Review of Critical Care Medicine

  • Blog Stats

    • 773,362 hits
  • Disclaimer

    The author does not take over any guarantee for the topicality, the correctness, completeness or quality of the information, made available. Liability claims against the author, concerning damage of idealistic or of material kind, which was caused by the use or not use of the presented information and/or by the use of incorrect and incomplete information, are in principle impossible, so far as not a deliberate or roughly negligent fault can be proved on the part of the author. The documents and graphics on this Web site can be affected by technical inaccuracies or misprints, for which we don't assume any liability. Furthermore,quotation from a book or the incidental capturing of copyrighted material in a segment of a MCQ should be considered as "FAIR USE".It is only for nonprofit educational purposes.The display is a regular part of the systematic instructional activities of this non-profit educational website and is meant entirely as help to solve the ever-challenging MCQs.Due respect has been given to great medical authors and their names displayed prominently alongside quotations/pictures or paragraphs.
  • Member of The Internet Defense League

  • Follow Review of Critical Care Medicine on WordPress.com
  • December 2025
    M T W T F S S
    1234567
    891011121314
    15161718192021
    22232425262728
    293031  
  • Recommended Books

  • Webchat

Archive for the ‘Medical’ Category

I Was a Saline Intensivist—Until DKA Changed My Mind- Now I’m Balanced one

Posted by Dr KAMAL DEEP on July 22, 2025

From Saline to Balanced: My Shift as an Intensivist, and What DKA Taught Me About Acid-Base

A few years ago, I was what you’d call a “saline intensivist.” Like many of us trained in the fast-paced world of critical care, I reached for normal saline as my default resuscitation fluid. It was reliable, familiar, and widely available. But over time—and with a growing body of evidence—I’ve come to understand that “normal” saline isn’t always physiological, especially when it comes to complex acid-base disorders like diabetic ketoacidosis (DKA).

Today, I practice more as a “balanced intensivist,” and DKA is one of the classic cases that illustrates why fluid choice matters.

DKA: The Classic High-Anion Gap Acidosis

In DKA, the absence of insulin drives the body to burn fat for energy, leading to the accumulation of ketone bodies like beta-hydroxybutyrate and acetoacetate. These organic acids overwhelm the buffering capacity of the body, consuming bicarbonate and resulting in a high-anion gap metabolic acidosis (HAGMA).

At this stage, the acidosis is caused by too many acids, not the loss of base.

The Shift: From HAGMA to NAGMA During Recovery

As we begin treatment—with insulin and fluids—the production of ketones stops. The kidneys then begin to excrete the excess ketone anions in the urine. But here’s the catch: those ketones are actually bicarbonate precursors. If retained, they would eventually regenerate bicarbonate as they are metabolized.

When they’re lost in the urine—along with sodium or potassium—we also lose the potential to regenerate bicarbonate. This is functionally equivalent to losing base, not adding acid.To maintain electrical balance, the kidneys start retaining chloride.

And if we’re giving large volumes of 0.9% normal saline, which already contains 154 mmol/L of chloride, we’re further loading the system with chloride.

The result? A normal anion gap metabolic acidosis (NAGMA)—also called hyperchloremic acidosis. The original ketone-driven HAGMA has resolved, but the patient now has a new, iatrogenic acidosis driven by bicarbonate loss and chloride gain.

Balanced Crystalloids: More Than Just a Trend

Balanced salt solutions like Ringer’s lactate have a lower chloride content and include buffering agents like acetate or lactate that are metabolized to bicarbonate. They’re less likely to cause or worsen hyperchloremic acidosis, especially in the DKA recovery phase.

Several studies—including SPLIT, SALT-ED, and SMART—have consistently shown benefits of balanced fluids in terms of acid-base balance, kidney outcomes, and even mortality in some subgroups. While not DKA-specific, the logic applies cleanly here.

So Why Did I Switch?

Because I saw it with my own eyes.

I saw patients recover from DKA only to remain acidotic from fluids we gave them. I saw chloride levels climb while bicarbonate remained stubbornly low. And I saw that simply switching from saline to a balanced solution often helped correct that persistent acidosis faster—and more physiologically.

Key Takeaways for Clinicians

In early DKA, acidosis is due to ketone accumulation (HAGMA). During recovery, renal loss of ketone salts (which are bicarbonate precursors) leads to bicarbonate depletion. Chloride retention, especially from normal saline, replaces the lost bicarbonate, causing a normal anion gap metabolic acidosis (NAGMA). Balanced fluids reduce this risk by supplying less chloride and offering bicarbonate precursors.

Final Thoughts

We often think of fluids as neutral tools, but in critical care, fluids are drugs. Their composition, volume, and timing all matter. In DKA, understanding the physiology of acid-base balance during recovery can help us choose fluids more wisely—and avoid replacing one problem with another.

I used to be a saline intensivist.

Now, I’m balanced.

Posted in Medical | Tagged: , | Leave a Comment »

The Protein Puzzle in Critical Care

Posted by Dr KAMAL DEEP on March 9, 2025

Introduction: The Complex Role of Protein in ICU Patients

For decades, ICU nutrition guidelines emphasized high protein intake (≥1.5 g/kg/day) to combat muscle wasting, malnutrition, and immune dysfunction in critically ill patients. However, recent landmark RCTs and meta-analyses have challenged the belief that “more protein is always better.”

Definition of Sarcopenia

• Consensus Definitions:

Major working groups such as the European Working Group on Sarcopenia in Older People (EWGSOP) and the Asian Working Group for Sarcopenia (AWGS) define sarcopenia as a condition involving both low muscle quantity and low muscle function (either strength or performance).

• Probable Sarcopenia: Identified by low muscle strength (commonly measured by handgrip strength).

• Confirmed Sarcopenia: When low muscle mass is also present.

• Severe Sarcopenia: When there is low muscle mass, low muscle strength, and poor physical performance (e.g., slow gait speed).

Methods to Measure Sarcopenia

1. Imaging Techniques for Muscle Mass

• Dual-Energy X-ray Absorptiometry (DXA):

• Pros: Widely used; provides detailed body composition analysis.

• Cons: Requires patient transfer and specialized equipment; less practical in critically ill patients.

• Computed Tomography (CT) and Magnetic Resonance Imaging (MRI):

• Pros: Considered gold standards for measuring muscle cross-sectional area; excellent image quality.

• Cons: Exposure to radiation (CT), high cost, and impractical for repeated bedside evaluations.

• Ultrasound:

• Pros: Non-invasive, portable, and repeatable at the bedside.

• How It’s Done:

• Site: The rectus femoris muscle of the thigh is commonly used.

• Technique:

• Patient Positioning: Patient is in a supine position with the knee extended and relaxed.

• Landmarks: Measure at the midpoint between the anterior superior iliac spine (ASIS) and the patella.

• Probe: A high-frequency linear probe (7–12 MHz) is used.

• Measurements:

• Muscle Thickness (RF-MLT): Distance between the superficial and deep fascia layers of the muscle.

• Cross-Sectional Area (RF-CSA): Outline the muscle boundary to calculate area.

• Interpretation: A reduction of more than 10% in muscle thickness over 7 days is often considered indicative of significant muscle wasting, which correlates with sarcopenia and poorer outcomes.

• Bioelectrical Impedance Analysis (BIA):

• Pros: Quick and easy; provides estimates of fat-free mass.

• Cons: Accuracy can be affected by fluid shifts common in critically ill patients.

2. Functional Measures

• Handgrip Strength:

• Method: Use a dynamometer to measure the maximum voluntary contraction of the hand.

• Thresholds (EWGSOP2): Common cutoffs are <27 kg for men and <16 kg for women in older adults, though ICU-specific thresholds might differ.

• Significance: Reduced grip strength is a strong predictor of sarcopenia and overall functional decline.

• Physical Performance Tests:

• Tests such as gait speed or the Short Physical Performance Battery (SPPB) are used in ambulatory patients but are often not feasible in critically ill, immobilized patients.

Because sarcopenia encompasses both muscle mass and muscle function, the diagnosis is typically made by combining measurements:

• Step 1: Screening for low muscle strength (e.g., low handgrip strength).

• Step 2: Confirming low muscle mass through imaging (ultrasound, DXA, CT) or body composition analysis (BIA).

• Step 3: Assessing physical performance (if possible), to gauge the severity.

Integration with Nutritional Assessments:

Tools like GLIM, NRS-2002, and mNUTRIC incorporate various parameters (e.g., weight loss, BMI, decreased food intake, severity of illness) to assess nutritional risk. Although these tools have limitations in the ICU (due to fluid shifts and rapid metabolic changes), they can be complemented by direct muscle measurements to provide a fuller picture of a patient’s nutritional and functional status.

• Implications for Treatment:

Early identification of sarcopenia through ultrasound and functional tests can lead to timely interventions, such as adjusting protein intake, initiating early mobilization, and using anabolic agents or nutritional supplements (e.g., HMB) to preserve muscle mass.

This article will cover:

✅ What does the latest research say about protein intake in ICU patients?

✅ How does malnutrition impact ICU outcomes, and how can we assess it?

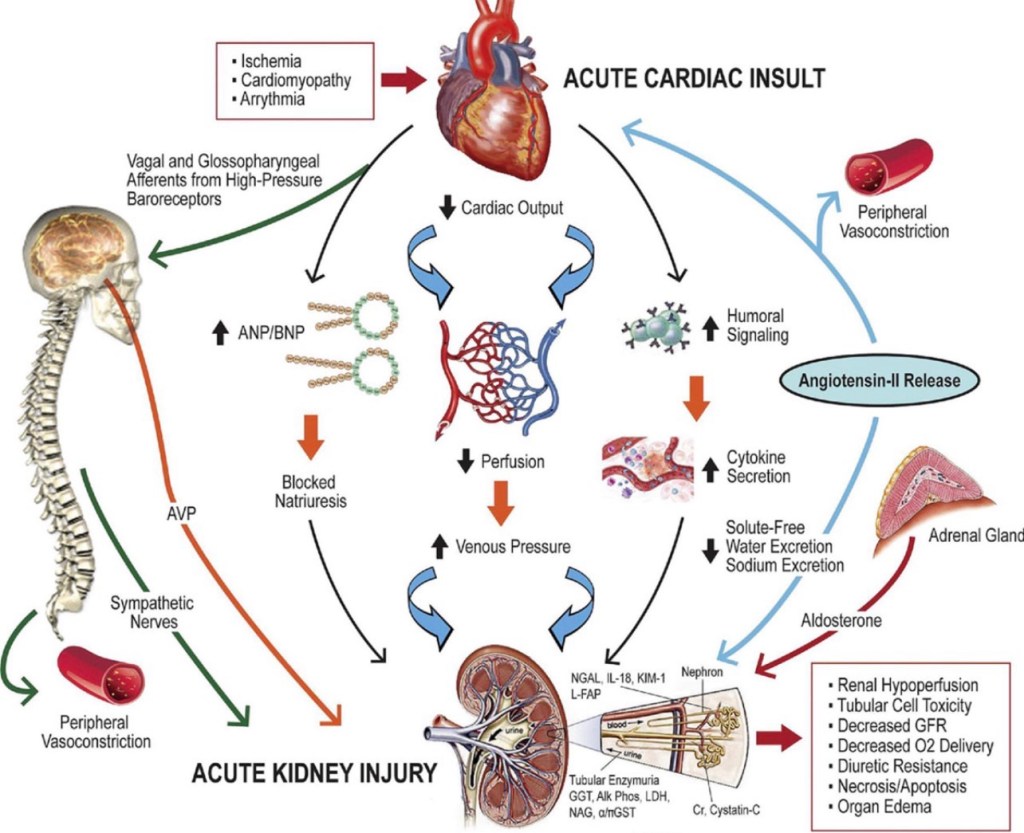
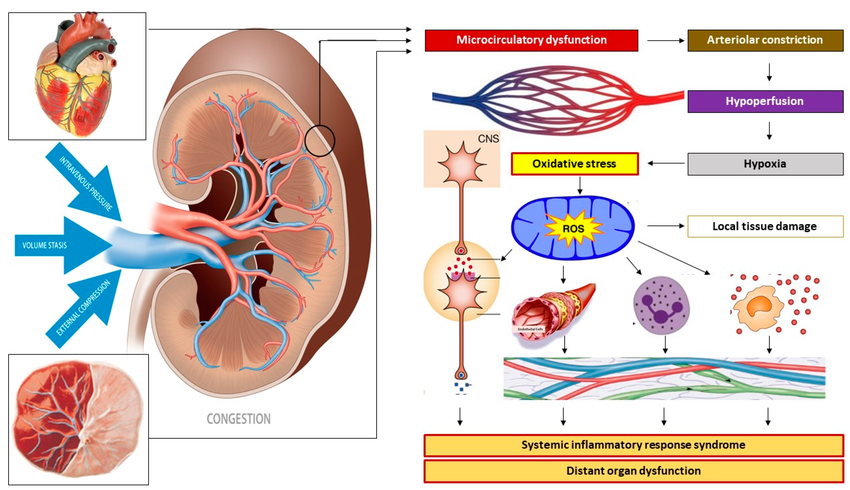
✅ Why might excessive protein be harmful in conditions like AKI?

✅ What are the molecular mechanisms of muscle wasting in ICU patients?

✅ How can bedside ultrasound help monitor muscle loss?

✅ What is the optimal protein dosing strategy for different ICU populations?

By the end, we’ll establish a personalized, evidence-based approach to ICU protein nutrition.

1. The Burden of Malnutrition in ICU Patients

Malnutrition is common in ICU patients due to:

🔹 Hypermetabolism & catabolic stress (sepsis, trauma, burns)

🔹 Reduced oral/enteral intake (NPO status, GI dysfunction)

🔹 Muscle breakdown from immobilization & inflammation

📊 Key Facts:

• Up to 60% of ICU patients develop malnutrition within 48 hours of admission

• Malnourished ICU patients have:

🚨 Higher mortality (30–50%)

🚨 Longer mechanical ventilation & ICU stay

🚨 Greater risk of ICU-acquired weakness (ICUAW)

How Do We Assess Malnutrition in ICU Patients?

🔹 1. GLIM Criteria (Global Leadership Initiative on Malnutrition)

📌 Two-Step Diagnosis:

1️⃣ Phenotypic Criteria (Need at least 1)

• Weight loss (>5% in 6 months or >10% in 1 year)

• Low BMI (<20 if <70 years, <22 if >70 years)

• Reduced muscle mass (via ultrasound, CT, bioimpedance)

2️⃣ Etiologic Criteria (Need at least 1)

• Reduced food intake/absorption (>50% of needs for >1 week)

• Systemic inflammation (sepsis, burns, major surgery)

🚀 Patients meeting 1 phenotypic + 1 etiologic criterion = Malnutrition diagnosis

🔹 2. NRS-2002 (Nutritional Risk Screening – 2002)

📌 Used in ICU to screen for malnutrition risk

🔹 Scoring System (0–6 points):

✔ Nutritional Status (0-3 points) → Weight loss, BMI, intake reduction

✔ Disease Severity (0-3 points) → Sepsis, major surgery, ICU stay

✔ Age ≥70 years → Add +1 point

📌 Scores ≥3 indicate malnutrition risk → Early nutrition therapy needed

🔹 3. mNUTRIC Score (Modified Nutrition Risk in Critically Ill)

📌 Designed for ICU patients to predict mortality risk

🔹 Includes:

✔ APACHE II / SOFA score

✔ Age, BMI, number of comorbidities

✔ Days from ICU admission to nutrition initiation

🚀 mNUTRIC ≥5 = High risk → Early aggressive nutrition needed

2. ICU-Acquired Weakness (ICUAW): Causes & Prevention

What Causes ICUAW?

🚨 Critical illness leads to a combination of:

• Inflammation-induced muscle breakdown (TNF-α, IL-6, IL-1β)

• Corticosteroid-induced myopathy

• Mitochondrial dysfunction

• Insulin resistance & anabolic resistance

• Disuse atrophy from bed rest

📊 Up to 50% of ventilated ICU patients develop ICUAW, leading to:

🚨 Delayed ventilator weaning

🚨 Longer ICU stay

🚨 Increased 1-year mortality

3. Molecular Mechanisms of Muscle Loss in ICU Patients

✅ Muscle protein synthesis is impaired due to:

• mTOR inhibition by inflammatory cytokines

• Suppression of IGF-1 (growth factor needed for muscle regeneration)

🚨 Muscle breakdown is accelerated due to:

• Activation of Ubiquitin-Proteasome System (UPS)

• Mitochondrial dysfunction leading to oxidative stress

🔬 Anabolic resistance → Even with high protein intake, ICU patients fail to utilize amino acids efficiently.

4. What Do Major Clinical Trials Say About ICU Protein Needs?

Major Clinical Trials: The High-Protein Controversy

🔹 EFFORT Trial (2023, The Lancet)

“More Protein Didn’t Improve Outcomes—And May Have Harmed Some Patients.”

• Study Design: Large multicenter RCT (85 ICUs, 1,301 patients)

• Intervention: High protein (2.2 g/kg/day) vs. Standard protein (1.2 g/kg/day)

• Primary Outcome: No difference in time-to-discharge-alive (p=0.27)

🔍 Key Findings:

🚨 High protein worsened outcomes in AKI patients (HR 1.12, 95% CI: 1.02–1.27)

🚨 No benefit in mortality, ventilator-free days, or infections

📌 Takeaway: Very high protein (>2.2 g/kg/day) might be harmful, especially in AKI & multi-organ failure patients.

🔹 TARGET Trial (2018, NEJM)

“More Calories Did Not Improve Survival.”

• Study Design: Multicenter RCT (3,957 ICU patients)

• Intervention: High-energy EN (1.5 kcal/ml) vs. Standard EN (1 kcal/ml)

• Primary Outcome: No difference in 90-day mortality

🔍 Key Findings:

❌ Higher calorie intake did not reduce ICU mortality or ventilator duration

❌ No reduction in infections or complications

📌 Takeaway: Caloric overfeeding is ineffective—protein needs should be separately optimized.

🔹 NUTRIREA-2 Trial (2018, JAMA)

“Route of Feeding Matters More Than the Protein Dose.”

• Study Design: Multicenter RCT (2,400 ICU patients)

• Intervention: Early Enteral Nutrition (EN) vs. Early Parenteral Nutrition (PN)

• Primary Outcome: No difference in 28-day mortality

🔍 Key Findings:

🚨 EN group had more GI complications (vomiting, diarrhea, aspiration pneumonia)

🚨 PN group had more bloodstream infections

📌 Takeaway: EN remains the preferred route, but careful monitoring for GI intolerance is needed.

🔹 2024 Meta-Analysis (Lee et al.)

“High Protein Increased Mortality in AKI Patients.”

• Data: 23 RCTs, 3,303 ICU patients

• Primary Outcome: No mortality benefit of high protein overall

🔍 Key Findings:

🚨 Increased mortality in AKI patients (42% higher risk, NNH = 7)

✅ High protein preserved muscle mass but increased nitrogen waste

📌 Takeaway: Moderate protein (~1.2–1.5 g/kg/day) is safest, while AKI patients should receive ≤1.2 g/kg/day.

However, excessive protein intake may:

❌ Increase metabolic waste (urea, nitrogen load), worsening AKI

❌ Cause unintended hyperglycemia (via gluconeogenesis)

❌ Fail to translate into better survival outcomes (as seen in recent trials)

Study

Protein Intake

Key Findings

EFFORT (2023, Lancet)

2.2 g/kg/day vs. 1.2 g/kg/day

Higher protein increased mortality in AKI patients (p=0.005) 🚨 No benefit in ICU/hospital stay ❌

TARGET (2018, NEJM)

High-calorie EN (1.5 kcal/ml) vs. Standard EN (1 kcal/ml)

No survival benefit of increased calorie intake ❌

NUTRIREA-2 (2018, JAMA)

Early EN vs. Early PN

No difference in mortality, but EN caused more GI issues ❌

Meta-Analysis (2024, Lee et al.)

1.5 g/kg/day vs. 0.92 g/kg/day

🚨 High protein increased AKI mortality by 42% (NNH = 7) ❌ No mortality benefit overall

📌 Takeaway: Moderate protein (1.2–1.5 g/kg/day) is safest, while AKI patients should receive ≤1.2 g/kg/day.

5. Bedside Ultrasound for Muscle Monitoring in ICU

✅ Rectus Femoris ultrasound (RF-US) is the best tool for real-time muscle loss assessment.

📊 How to interpret:

📉 >10% muscle loss in 7 days → ICUAW risk

📉 >15% loss over ICU stay → Long-term disability risk

🔬 Combining nutrition + rehab (electrical stimulation, resistance exercise) improves muscle preservation.

6. Practical ICU Protein Guidelines Based on Current Evidence

Patient Type

Protein Intake

General ICU Patients

1.2–1.5 g/kg/day

Sepsis, Trauma, Burns

1.5–2.5 g/kg/day

AKI (No CRRT)

≤1.2 g/kg/day

CRRT (Dialysis Patients)

2.0–2.5 g/kg/day

The ESPEN guidelines on clinical nutrition in the ICU provide several key recommendations on protein intake, timing, and considerations for different patient groups. Here are the most relevant points extracted from the document:

Protein Intake Recommendations

• General ICU Patients: ESPEN recommends 1.3 g/kg protein equivalents per day during critical illness, delivered progressively .

• Sepsis & Septic Shock: ESPEN does not provide a single definitive target but suggests avoiding overfeeding, as septic patients may not benefit from increased protein intake (1.2 g/kg/d) compared to non-septic patients, though no harm was reported either .

• Acute Kidney Injury (AKI): Traditional recommendations suggest 1.2-1.5 g/kg/d, but some studies indicate that higher protein intake might be associated with worse outcomes in AKI patients not receiving renal replacement therapy .

• Sarcopenic ICU Patients: Those with muscle loss may benefit more from >1.2 g/kg/day protein intake .

• Parenteral Nutrition (PN): ESPEN suggests that PN should be used if enteral nutrition (EN) is insufficient after three days. Overfeeding should be avoided in the first days of ICU admission 

1. Acute Phase of Sepsis:

During the initial acute phase (first 24–96 hours), it’s recommended to provide a protein intake of approximately 1.0 g/kg/day. This approach aims to balance the need for protein while avoiding potential adverse effects associated with higher protein delivery during this critical period. 

2. Post-Acute Phase of Sepsis:

After the acute phase, as the patient stabilizes, increasing protein intake becomes crucial to minimize muscle loss and support recovery. Guidelines suggest aiming for a protein intake of 1.2–2.0 g/kg/day during this period. 

3. Recovery Phase:

In the recovery phase, particularly for patients engaging in rehabilitation and physical therapy, protein requirements may further increase. Some recommendations advocate for protein intakes up to 2.0 g/kg/day to support muscle rebuilding and overall recovery. 

Clinical Evidence Supporting Higher Protein Intake:

• A retrospective study observed that patients with sepsis who received higher protein intake during the first week had a lower in-hospital mortality rate. Specifically, an average daily protein intake was associated with a reduced risk of in-hospital death. 

• The ESPEN guidelines on clinical nutrition in the ICU highlight that protein intakes greater than 1.2 g/kg/day are associated with improved outcomes in critically ill patients, including those with sepsis. 

It’s important to note that while higher protein intake is beneficial during the post-acute and recovery phases, individual patient factors such as kidney function, metabolic status, and overall clinical condition should guide specific protein targets. Close monitoring and adjustment of nutritional strategies are essential to optimize outcomes in septic patients.

🚀 The future isn’t “more protein” but “right protein, right patient, right time.”

📌 Final Thought: ICU nutrition must be tailored—not just based on general guidelines, but on real-time patient responses.

Extras

Detailed Overview of HMB (β-Hydroxy β-Methylbutyrate) in ICU Patients

HMB (β-Hydroxy β-Methylbutyrate) is a metabolite of leucine that has been widely studied for its muscle-preserving and anabolic effects in critically ill patients. Below is a comprehensive review of its mechanism of action, clinical benefits, side effects, and landmark studies supporting its use.

1. Mechanism of Action: How HMB Works in ICU Patients

HMB exerts multiple beneficial effects in critically ill, immobilized, and muscle-wasting patients through the following mechanisms:

(A) Stimulation of Muscle Protein Synthesis (mTOR Activation)

✅ HMB activates the mTOR pathway, which is the key regulator of muscle growth.

✅ This leads to increased muscle protein synthesis (MPS) → Helps maintain lean body mass.

✅ Unlike leucine, HMB is more potent in stimulating MPS because it bypasses certain metabolic steps.

📌 Supporting Study:

• Eley et al. (2008): HMB increased muscle protein synthesis by 30% in septic rats.

(B) Inhibition of Muscle Protein Breakdown (Ubiquitin-Proteasome Pathway Suppression)

✅ Critical illness activates the Ubiquitin-Proteasome System (UPS) → leading to muscle proteolysis (breakdown).

✅ HMB directly inhibits UPS, preventing excessive protein degradation.

✅ This helps preserve muscle mass even during immobilization or sepsis.

📌 Supporting Study:

• Smith et al. (2005): HMB reduced muscle protein breakdown by 50% in cachectic cancer patients.

(C) Anti-Inflammatory Effects (↓ TNF-α, IL-6, IL-1β)

✅ Critical illness triggers systemic inflammation (sepsis, trauma, burns), leading to muscle wasting.

✅ HMB reduces pro-inflammatory cytokines (IL-6, TNF-α, IL-1β) → Improves muscle retention.

✅ HMB also preserves mitochondrial function, reducing oxidative stress.

📌 Supporting Study:

• Hsieh et al. (2006): ICU patients receiving HMB-enriched nutrition had a 59% reduction in CRP (inflammatory marker).

(D) Enhancing Immune Function & Wound Healing

✅ HMB supports immune cell function by maintaining glutathione levels.

✅ Stimulates collagen synthesis → Improves wound healing in post-surgical ICU patients.

📌 Supporting Study:

• Clark et al. (2000): HMB improved wound healing & reduced hospital stay in elderly ICU patients.

2. Clinical Benefits of HMB in ICU Patients

HMB is particularly useful in catabolic ICU conditions where muscle loss is rapid and severe.

✅ Preserves Muscle Mass & Strength

• ICU patients lose 2-4% of muscle mass per day due to immobilization.

• HMB supplementation slows down this muscle loss by inhibiting protein breakdown.

• Deutz et al. (2013): HMB prevented significant muscle atrophy in ICU patients receiving high-protein enteral nutrition.

✅ Reduces ICU-Acquired Weakness (ICU-AW)

• ICU-AW affects 40-50% of critically ill patients, leading to long-term disability.

• HMB supplementation improves functional outcomes (grip strength, mobility).

• NOURISH Trial (2016): ICU patients receiving HMB-enriched oral nutrition supplements (ONS) had a 50% lower 90-day mortality.

✅ Supports Recovery Post-ICU (Rehabilitation Phase)

• Post-ICU patients continue losing muscle for weeks to months after discharge.

• HMB combined with physiotherapy accelerates muscle recovery & reduces re-hospitalization.

• Deutz et al. (2021): ICU patients receiving HMB showed improved physical function at 30 days post-discharge.

3. Landmark Studies Supporting HMB Use in ICU

Study

Key Findings

Clinical Impact

Deutz et al. (2013)

HMB preserved muscle mass in ICU patients receiving high-protein EN.

Supports HMB in ICU nutrition.

NOURISH Trial (2016)

HMB-enriched ONS reduced 90-day mortality by 50%.

Strong evidence for HMB in ICU recovery.

Hsieh et al. (2006)

CRP reduced by 59% in ICU patients receiving HMB.

HMB has anti-inflammatory benefits.

Eley et al. (2008)

HMB increased muscle protein synthesis by 30% in sepsis.

Supports HMB in ICU-acquired weakness.

Clark et al. (2000)

HMB improved wound healing & recovery in ICU.

Useful in post-surgical patients.

📌 Takeaway:

HMB has well-documented benefits for ICU patients, including muscle preservation, inflammation reduction, and improved recovery.

4. HMB Dosage & Administration in ICU

Route

Recommended Dose

Duration

Oral / Enteral (EN)

3 g/day (divided into 2-3 doses)

Minimum 7-14 days, ideally 4-6 weeks

Parenteral (IV HMB not widely available)

Not routinely used

📌 Best Administered With:

✔ High-protein EN (whey/casein) → Enhances muscle anabolism.

✔ Omega-3s (EPA/DHA) → Synergistic anti-inflammatory effect.

5. Potential Side Effects of HMB

HMB is very safe, but some mild side effects have been reported:

Side Effect

Frequency

Clinical Relevance

Mild GI Discomfort (bloating, diarrhea)

Rare (<5% of patients)

Dose-dependent, resolves with lower dose

Hypoglycemia Risk (in diabetics)

Low

Monitor blood sugar in insulin-dependent patients

No Liver/Kidney Toxicity

None reported

Safe for long-term ICU use

📌 Safety Summary:

✔ HMB has no major side effects.

✔ Safe in elderly, renal failure, and chronic ICU patients.

✔ Can be continued post-ICU to aid rehabilitation.

6. Final Takeaways

✔ HMB is a potent muscle-preserving agent, working via mTOR activation & protein breakdown inhibition.

✔ HMB reduces inflammation, improving ICU recovery.

✔ HMB supplementation (3 g/day) is recommended in critically ill patients at risk of muscle loss.

✔ Safe, with no major side effects (unlike anabolic steroids).

✔ HMB should be combined with high-protein nutrition + physiotherapy for best results.

Vanhorebeek I, et al. (2020) – ICU-Acquired Weakness Review

🔹 Objective:

• Comprehensive review of ICU-acquired weakness (ICU-AW), its mechanisms, and interventions.

🔹 Key Findings:

• ICU-AW is caused by sepsis, hyperglycemia, neuromuscular blockers, and prolonged immobility.

• 40% of ICU patients develop ICU-AW; in surgical ICUs, this rate is 56-74%.

🔹 Clinical Impact:

• Early mobilization, nutrition (≥1.5 g/kg protein/day), and glucose control are key to preventing ICU-AW.

📌 Reference: Vanhorebeek I, et al. Intensive Care Med. 2020;46(4):637-53 

Appleton RT, et al. (2015) – Incidence of ICU-AW

🔹 Objective:

• Systematic review analyzing the prevalence of ICU-AW in critically ill patients.

🔹 Key Findings:

• 4 out of 10 critically ill patients develop ICU-AW.

• ICU-AW significantly delays recovery and increases mortality.

🔹 Clinical Impact:

• ICU patients should undergo early screening for weakness & receive aggressive rehabilitation.

📌 Reference: Appleton RT, et al. J Intensive Care Soc. 2015;16(2):126-36 

Wang W, et al. (2020) – ICU-AW & Nutrition

🔹 Objective:

• Reviewed nutritional strategies for ICU-AW patients.

🔹 Key Findings:

• Early enteral nutrition (EN) is superior to PN unless contraindicated.

• Delaying PN for 7 days reduces infection risk (EPaNIC Trial).

🔹 Clinical Impact:

• Reinforces ESPEN guidelines recommending early EN over PN in critically ill patients.

📌 Reference: Wang W, et al. Front Med (Lausanne). 2020;7:559789 

Lees et al. (2024) – Muscle Loss in ICU Patients

🔹 Objective:

• Examined muscle wasting trends in critically ill patients across different conditions.

🔹 Key Findings:

• ICU patients lose ~2% of muscle mass per day in the first week.

• 15% muscle loss in 1 week → ICU-AW develops in ~50% of patients.

🔹 Clinical Impact:

• Supports high-protein feeding (1.5-2.0 g/kg/day) & resistance training in ICU.

📌 Reference: Lees et al. Crit Care Clin. 2024 

Yuan G, et al. (2021) – ICU-AW & Muscle Mass

🔹 Objective:

• Investigated erector spinae muscle cross-sectional area in ICU-AW patients.

🔹 Key Findings:

• Significant muscle atrophy seen as early as day 7 of ICU stay.

• Worse prognosis in ICU patients with severe muscle loss.

🔹 Clinical Impact:

• ICU teams should monitor muscle loss using imaging & functional assessments.

📌 Reference: Yuan G, et al. Medicine (Baltimore). 2021;100(47):e27806 

Prado CM, et al. (2023) – Muscle’s Role in Metabolism

🔹 Objective:

• Analyzed muscle’s role as a metabolic organ & its impact on ICU recovery.

🔹 Key Findings:

• Muscle regulates glycemic control, immune function, and inflammation.

• Severe muscle loss post-ICU increases mortality & disability.

🔹 Clinical Impact:

• ICU recovery strategies must include nutritional & resistance training approaches.

📌 Reference: Prado CM, et al. JPEN J Parenter Enteral Nutr. 2023 

He Y, et al. (2019) – ONS & Surgical Site Infection in Orthopedic Patients

🔹 Objective:

• Evaluated whether ONS can reduce postoperative infections and readmission rates in elderly orthopedic patients with hypoalbuminemia.

🔹 Key Findings:

• ONS reduced 30-day readmission risk by 78%.

• Lower incidence of prosthetic joint infection.

🔹 Clinical Impact:

• ONS should be routinely provided postoperatively to improve nutritional status and lower infection risks.

📌 Reference: He Y, et al. J Orthop Surg Res. 2019;14(1):292 

Deutz NE, et al. (2021) – ONS & Handgrip Strength

🔹 Objective:

• Studied the effect of ONS on muscle strength (handgrip) in ICU patients with chronic obstructive pulmonary disease (COPD).

🔹 Key Findings:

• ONS improved handgrip strength significantly at day 30 post-discharge.

• CRP (inflammatory marker) levels decreased by 59%, indicating reduced systemic inflammation.

🔹 Clinical Impact:

• Suggests ONS has both anabolic and anti-inflammatory benefits for critically ill patients.

📌 Reference: Deutz NE, et al. Clin Nutr. 2021;40(3):1388-95 

Deutz NE, et al. (2016) – NOURISH Trial: ONS & ICU Recovery

🔹 Objective:

• Evaluated the impact of specialized oral nutritional supplements (ONS) on mortality and readmission rates in malnourished hospitalized older adults.

🔹 Key Findings:

• ONS significantly reduced 90-day mortality.

• Improved handgrip strength & body weight at day 30.

• Reduced hospital readmission rates.

🔹 Clinical Impact:

• Supports the use of high-protein ONS in ICU recovery to reduce mortality and improve muscle strength.

📌 Reference: Deutz NE, et al. Clin Nutr. 2016;35(1):18-26 

Posted in Medical | Leave a Comment »

The Hidden Risks of Percutaneous Dilatational Tracheostomy (PDT): How Force and Technique Make the Difference

Posted by Dr KAMAL DEEP on February 26, 2025

Percutaneous dilatational tracheostomy (PDT) has revolutionized airway management in intensive care units (ICUs). Its minimally invasive nature, ability to be performed bedside, and cost-effectiveness make it a preferred choice for patients requiring prolonged ventilation. However, as simple as it may seem, the success and safety of PDT hinge on one critical factor: the force applied during the procedure.

Emerging evidence highlights how excessive dilatational force can lead to catastrophic complications. Understanding this risk and adopting refined techniques such as controlled force application and pre-dilation dissection can significantly improve outcomes.

The Role of Dilatational Force

During PDT, the tracheal stoma is dilated to insert the tracheostomy tube. This process involves the application of force, often using instruments such as the Griggs forceps or Ciaglia Blue Rhino (CBR) dilator. While straightforward in concept, the force applied during dilation is a double-edged sword:
• Low Force: Ensures controlled dilation with minimal trauma to the tracheal rings and surrounding tissue.
• Excessive Force: Risks complications such as tracheal cartilage fractures, subcutaneous emphysema, pneumothorax, or even complete tracheal rupture.

A 2019 report highlighted two real-world cases of tracheal rupture during PDT, even when performed under bronchoscopic guidance. Excessive force or the operator’s inability to identify pre-rupture signs, such as anterior-posterior tracheal wall approximation, played a significant role in these complications.

What Research Reveals About Force Management

Recent studies have quantified the forces applied during PDT, providing insights into how experience and technique influence safety:
1. Force Profiles Differ by Expertise
• Experienced surgeons applied significantly lower forces, averaging 31.3 N (mean) compared to 48.8 N for less experienced operators.
• Procedures performed by experienced surgeons showed smoother and more consistent force curves, typically with a single peak indicating controlled dilation.
• In contrast, less experienced surgeons produced inconsistent force curves with multiple peaks, indicating poor positioning and increased tissue trauma risk.
2. Force Magnitude and Moments
• Axial force (P) was the dominant force during the procedure, but bending moments (Mx, My) and torque (Mz) were higher in less experienced operators, reflecting inefficient technique and potential for injury.
• The peak axial force reached up to 88.2 N in inexperienced hands, compared to 82.8 N in experienced ones—a critical difference when dealing with fragile tracheal structures.
3. Simulations Show the Path to Improvement
• Using a strain-gauge-equipped CBR dilator, researchers demonstrated that training and feedback could significantly reduce variability and improve procedural safety.

Why Some Dissection is Necessary

Pre-dilation dissection, though not always emphasized, can reduce the resistance faced during dilation:
• Clearing Tissue Resistance: Limited pre-tracheal dissection minimizes the force required to insert the dilator, reducing stress on tracheal rings.
• Avoiding Cartilage Damage: In cases of prolonged intubation or infection, tracheal rings may weaken or become flaccid, making them more susceptible to rupture even under normal force.

Both the 2018 experimental study and real-world cases from 2019 emphasize that minor preparatory dissection can make a substantial difference in procedural outcomes.

Training and Technology: The Future of Safer PDT

The studies also highlight the role of advanced tools and structured training in preventing complications:
1. Force-Sensing Dilators:
• Devices equipped with strain gauges provide real-time feedback on the forces applied, alerting operators when they exceed safe thresholds.
• Such tools can guide less experienced surgeons toward a safer, more consistent technique.
2. Simulation-Based Training:
• Using lifelike tracheostomy simulators, operators can practice applying optimal forces and refine their skills without putting patients at risk.
• Incorporating visual or auditory feedback during simulations can further enhance learning.
3. Standardized Techniques:
• Following well-defined procedural steps, including pre-dilation assessments and controlled force application, can minimize variability and ensure adherence to safety standards.

Takeaways for Clinicians
1. Excessive Dilatational Force Leads to Complications
• Tracheal rupture, cartilage damage, and post-procedure complications like tracheal stenosis are closely linked to higher force application.
2. Experience Matters
• Skilled operators use lower, more consistent forces, reducing procedural time and complication rates.
3. Pre-Dilation Dissection Improves Outcomes
• Small dissections before dilation reduce resistance and protect fragile tracheal structures.
4. Technology and Training Are Game-Changers
• Force-monitoring tools and simulation-based training can bridge the gap for less experienced practitioners, ensuring patient safety.

Conclusion

Percutaneous dilatational tracheostomy is a vital procedure in ICU care, but its success depends on precise execution. By understanding the risks of excessive force, embracing preparatory techniques like limited dissection, and leveraging modern training tools, clinicians can make PDT safer and more effective.

As research and technology continue to evolve, the future of PDT looks promising, offering new ways to standardize practices and reduce complications. Let’s work toward a safer, more consistent approach to this life-saving procedure.

Posted in Medical | Leave a Comment »

EDIC Part 1 Notes

Posted by Dr KAMAL DEEP on February 26, 2025

Posted in Medical | Leave a Comment »

Liberal vs. Restrictive Fluid Strategies in Sepsis: Evidence from Major RCTs

Posted by Dr KAMAL DEEP on February 24, 2025

1. Early Goal-Directed Therapy (EGDT) – Rivers et al., 2001

The EGDT trial, published in The New England Journal of Medicine in 2001, was a landmark study that changed the approach to early sepsis resuscitation. It introduced structured hemodynamic targets in the first 6 hours of sepsis management, leading to a significant reduction in mortality.


1. Study Design & Rationale

FeatureDetails
Full NameEarly Goal-Directed Therapy in the Treatment of Severe Sepsis and Septic Shock
ObjectiveTo determine if structured hemodynamic resuscitation within the first 6 hours of sepsis improves survival compared to usual care.
Study TypeSingle-center, randomized controlled trial (RCT), unblinded
LocationHenry Ford Hospital, Detroit, USA
Time PeriodMarch 1997 – March 2000
Number of Patients263 (EGDT: 130, Standard Care: 133)
SettingEmergency Department (ED) – patients presenting with early severe sepsis or septic shock
Follow-up Duration60 days
Primary EndpointIn-hospital mortality

📌 Why Was EGDT Needed?

  • Before EGDT, sepsis mortality was ~46%, and no structured resuscitation protocol existed.
  • Delayed fluid resuscitation, vasopressor use, and transfusions contributed to poor outcomes.
  • The trial tested whether early, aggressive hemodynamic resuscitation improves outcomes.

2. Inclusion & Exclusion Criteria

CriteriaDetails
Inclusion CriteriaSuspected or confirmed infection
Systolic BP <90 mmHg OR Lactate ≥4 mmol/L (signs of hypoperfusion)
Identified within 6 hours of ED presentation
Exclusion CriteriaAcute pulmonary edema (fluid restriction needed)
Active GI hemorrhage (requiring blood products)
DNR status, pregnancy, age <18 years
Already received >1L IV fluids before arrival

📌 Key Point: Patients included had severe sepsis or early septic shock but had not yet received aggressive resuscitation.


3. Intervention Arms & Protocols

FeatureEGDT Group (Structured Resuscitation)Standard Care Group
Fluids (First 6 Hours)30 mL/kg IV crystalloid bolus, then guided by CVPFluids given at clinician discretion
CVP Target8–12 mmHgNo specific target
MAP Target≥65 mmHg (fluids → vasopressors if needed)No strict MAP goal
ScvO₂ Target≥70% (if low, added dobutamine or transfusion if Hct <30%)Not measured
Urine Output Goal≥0.5 mL/kg/hrNo strict target
VasopressorsGiven if MAP <65 after fluidsUsed based on clinician discretion
Blood TransfusionIf hematocrit <30%Given if judged necessary
Dobutamine UseIf ScvO₂ <70% despite fluidsRarely used

📌 Why 30 mL/kg Fluids?

  • This volume was chosen to rapidly restore intravascular volume and improve perfusion.
  • A CVP target of 8–12 mmHg was used to guide additional fluids.

📌 Why ScvO₂ Monitoring?

  • ScvO₂ (central venous oxygen saturation) measures oxygen delivery vs. demand.
  • If ScvO₂ <70%, it suggests inadequate oxygen delivery → requiring inotropes (dobutamine) or transfusions.

4. Key Results & Outcomes

4.1 Fluids & Interventions Received

Parameter (First 6h)EGDT GroupStandard CareDifference
Total IV Fluids4.9L (IQR: 3.5–6.3L)3.5L (IQR: 2.5–5.0L)+1.4L in EGDT
Blood Transfusions (%)19%4%+15% in EGDT
Dobutamine Use (%)13.7%0.8%More frequent in EGDT

📌 EGDT patients received more fluids, blood transfusions, and inotropes than the standard care group.


4.2 Mortality Results

OutcomeEGDTStandard CareDifference
28-Day Mortality30.5%46.5%−16.0% (P = 0.009)
60-Day Mortality33.3%49.2%−15.9% (P = 0.01)

📌 EGDT reduced mortality by ~16%, making it one of the most impactful sepsis trials ever conducted.


5. Key Clinical Implications

EGDT proved that early, aggressive sepsis resuscitation saves lives.
Hemodynamic targets (CVP, MAP, ScvO₂) improved oxygen delivery and reduced multi-organ dysfunction.
A structured resuscitation protocol should begin within the first 6 hours of sepsis recognition.


6. Limitations & Controversies

🔹 Single-Center Study → Conducted only at Henry Ford Hospital (concerns about generalizability).
🔹 Control Group Received Suboptimal Care → Standard care patients may have been under-resuscitated.
🔹 ScvO₂ Monitoring is Invasive & Outdated → Later trials showed that ScvO₂ isn’t necessary for good outcomes.
🔹 PROCESS, ARISE, & PROMISE Trials (2014–2015) failed to replicate the mortality benefit → Questioning the necessity of strict EGDT protocols.


7. EGDT vs. Modern Practice (2024 Update)

EGDT (2001)Modern Sepsis Management (2024)
30 mL/kg fluids → CVP target (8–12 mmHg)30 mL/kg fluids → Dynamic assessment (PLR, VTI, IVC)
ScvO₂ monitoring with central lineCapillary refill time, lactate clearance instead
Dobutamine if ScvO₂ <70%Echocardiography-based cardiac function assessment
Blood transfusions if Hct <30%Less reliance on transfusions unless Hb <7 g/dL

📌 Key Change: EGDT’s aggressive protocol is no longer required, but the concept of early, structured resuscitation remains critical.


8. Final Take-Home Message

💡 “EGDT revolutionized sepsis care by proving that aggressive early resuscitation saves lives. However, modern sepsis management has evolved, focusing on dynamic assessments rather than fixed resuscitation targets.”

Next Trial: PROCESS (2014) – The First Major Challenge to EGDT

2. PROCESS Trial (2014) – Challenging EGDT

The PROCESS (Protocolized Care for Early Septic Shock) trial, published in The New England Journal of Medicine in 2014, was the first major study to challenge EGDT. It aimed to determine whether a structured, EGDT-like approach was superior to usual care in modern sepsis management.


1. Study Design & Rationale

FeatureDetails
Full NameProtocolized Care for Early Septic Shock (PROCESS)
ObjectiveTo compare EGDT vs. protocolized resuscitation vs. usual care in early septic shock
Study TypeMulticenter, RCT, unblinded, noninferiority trial
Location31 centers (USA)
Time PeriodMarch 2008 – May 2013
Number of Patients1,341
SettingEmergency Departments (ED) – patients presenting with early septic shock
Follow-up Duration60 days
Primary Endpoint60-day mortality

📌 Why Was PROCESS Needed?

  • Since EGDT (2001) showed a 16% mortality reduction, hospitals adopted CVP-guided resuscitation and ScvO₂ monitoring.
  • However, sepsis care had improved overall (early antibiotics, better ICU management), so it was unclear if EGDT was still necessary.
  • PROCESS tested whether EGDT still provided a survival benefit over modern usual care.

2. Inclusion & Exclusion Criteria

CriteriaDetails
Inclusion Criteria– Suspected infection + lactate ≥4 mmol/L OR persistent hypotension after 1L fluids
– Must be randomized within 2 hours of meeting criteria
Exclusion CriteriaDNR status, pregnancy, acute pulmonary edema, active bleeding
>2L fluids already given before randomization

📌 Key Difference from EGDT: Patients were enrolled within 2 hours (EGDT allowed 6 hours).


3. Intervention Arms & Protocols

FeatureEGDT (Rivers’ Protocol)Protocolized Standard CareUsual Care
Fluids (First 6 Hours)30 mL/kg IV crystalloid (CVP-guided)30 mL/kg IV crystalloid (MAP-guided)Fluids given at clinician’s discretion
VasopressorsMAP goal ≥65 mmHgMAP goal ≥65 mmHgUsed if necessary
ScvO₂ Target≥70% (via CVC monitoring)Not requiredNot required
Dobutamine UseIf ScvO₂ <70%Rarely usedRarely used
Blood TransfusionHematocrit <30%Hb <7 g/dLHb <7 g/dL

📌 Key Difference from EGDT: The protocolized standard care group received the same volume of fluids but without invasive ScvO₂ monitoring.


4. Key Results & Outcomes

4.1 Fluids & Vasopressor Use

Parameter (First 6h)EGDT GroupProtocolized CareUsual Care
Total IV Fluids4.9L3.9L3.3L
Vasopressors Use (%)54.9%52.2%44.1%
Dobutamine Use (%)8.0%1.1%0.9%
Blood Transfusion (%)14.4%8.3%7.5%

📌 Key Findings:

  • EGDT patients received more fluids, vasopressors, and blood transfusions.
  • Despite these interventions, mortality was the same in all three groups.

4.2 Mortality Results

OutcomeEGDTProtocolized CareUsual CareDifference
60-Day Mortality21.0%18.2%18.9%No significant difference (P = 0.83)
90-Day Mortality31.9%30.9%34.0%No significant difference (P = 0.61)

📌 Key Takeaway: EGDT did not improve survival compared to modern usual care.


5. Key Clinical Implications

EGDT’s structured protocol is not superior to modern usual care.
Early fluids (30 mL/kg) and MAP-guided resuscitation work just as well without ScvO₂ monitoring.
Routine blood transfusions and dobutamine use are unnecessary.

📌 PROCESS showed that modern sepsis care already includes aggressive early resuscitation, making EGDT redundant.


6. Limitations & Controversies

🔹 Unblinded Study → Clinicians knew which group patients were in, which may have influenced treatment.
🔹 Better Overall Sepsis Care → The control group received early antibiotics and fluid resuscitation, unlike the original EGDT trial in 2001.
🔹 Generalizability to Low-Resource Settings? → EGDT might still benefit hospitals without strong sepsis protocols.


7. EGDT vs. PROCESS – What Changed?

FeatureEGDT (2001)PROCESS (2014)
Required ScvO₂ Monitoring?Yes (central line needed)No (not necessary)
Fluids Given?30 mL/kg guided by CVP30 mL/kg guided by MAP
Vasopressor Use?Only after fluidsStarted earlier if MAP <65
Blood Transfusion?Hct <30%Hb <7 g/dL
Mortality Benefit?Yes (16% reduction)No difference

📌 Key Change: EGDT’s invasive monitoring and strict protocol were unnecessary when sepsis care improved overall.


8. Final Take-Home Message

💡 “PROCESS proved that modern sepsis care (early antibiotics, MAP-guided fluids, and vasopressors) is just as effective as EGDT. The key takeaway? We don’t need central line-driven ScvO₂ monitoring or rigid protocols anymore—what matters most is early resuscitation and individualized fluid management.”


3. ARISE Trial (2014) – Confirming the Findings of PROCESS

The ARISE (Australasian Resuscitation in Sepsis Evaluation) trial, published in The New England Journal of Medicine in 2014, was a large, multicenter, randomized controlled trial (RCT) designed to determine whether EGDT was superior to modern usual care in early septic shock. It was conducted simultaneously with the PROCESS trial and confirmed that EGDT is not necessary for good outcomes when early antibiotics and fluid resuscitation are provided.


1. Study Design & Rationale

FeatureDetails
Full NameAustralasian Resuscitation in Sepsis Evaluation (ARISE)
ObjectiveTo determine whether EGDT improves survival compared to usual care in early septic shock
Study TypeMulticenter, RCT, unblinded, noninferiority trial
Location51 centers (Australia, New Zealand, Finland, Hong Kong, Ireland, UK)
Time PeriodOctober 2008 – April 2014
Number of Patients1,600
SettingEmergency Departments (ED) – patients presenting with early septic shock
Follow-up Duration90 days
Primary Endpoint90-day all-cause mortality

📌 Why Was ARISE Needed?

  • PROCESS (2014) showed EGDT was not superior to usual care, but validation in a different healthcare system was needed.
  • The study tested whether EGDT’s strict targets (ScvO₂, CVP, dobutamine use) provided additional survival benefit in an era of early antibiotics, protocolized resuscitation, and ICU care.

2. Inclusion & Exclusion Criteria

CriteriaDetails
Inclusion Criteria– Suspected or confirmed infection
Lactate ≥4 mmol/L OR persistent hypotension (MAP <65) after 1L IV fluids
– Must be randomized within 6 hours of ED presentation
Exclusion CriteriaDNR status, pregnancy, acute pulmonary edema, active GI bleeding
>1L IV fluids already given before randomization

📌 Key Difference from PROCESS:

  • Patients were enrolled within 6 hours (PROCESS required enrollment within 2 hours).
  • More emphasis on early lactate-based screening.

3. Intervention Arms & Protocols

FeatureEGDT (Rivers’ Protocol)Usual Care
Fluids (First 6 Hours)30 mL/kg IV crystalloid (CVP-guided)Fluids given at clinician’s discretion
VasopressorsMAP goal ≥65 mmHgMAP goal ≥65 mmHg
ScvO₂ MonitoringYes (≥70%)Not required
Dobutamine UseIf ScvO₂ <70%Rarely used
Blood TransfusionHematocrit <30%Hb <7 g/dL

📌 Key Difference from EGDT (2001):

  • Usual care was already aggressive with early antibiotics and fluids, making additional interventions (ScvO₂ monitoring, dobutamine) unnecessary.

4. Key Results & Outcomes

4.1 Fluids & Vasopressor Use

Parameter (First 6h)EGDT GroupUsual CareDifference
Total IV Fluids4.3L4.0LNot significantly different
Vasopressors Use (%)76.3%67.7%Slightly more in EGDT group
Dobutamine Use (%)15.4%2.6%More in EGDT group
Blood Transfusion (%)13.6%7.0%More in EGDT group

📌 Key Findings:

  • EGDT patients received slightly more fluids, vasopressors, and dobutamine than usual care.
  • Despite these additional interventions, mortality was the same in both groups.

4.2 Mortality Results

OutcomeEGDTUsual CareDifference
90-Day Mortality18.6%18.8%No significant difference (P = 0.90)
ICU-Free Days14.3 days14.0 daysNo significant difference
Ventilator-Free Days19.5 days19.6 daysNo significant difference

📌 Key Takeaway: EGDT did not improve survival compared to modern usual care.


5. Key Clinical Implications

EGDT’s structured protocol is not superior to modern usual care.
Early antibiotics, aggressive resuscitation, and MAP-guided fluids work just as well.
Routine blood transfusions and dobutamine use are unnecessary.

📌 ARISE confirmed what PROCESS had already shown: EGDT is not needed when early sepsis care is optimized.


6. Limitations & Controversies

🔹 Unblinded Study → Clinicians knew which group patients were in, which could introduce bias.
🔹 Better Overall Sepsis Care → The control group received early antibiotics and fluid resuscitation, unlike in 2001 when EGDT was first introduced.
🔹 Does This Apply to Low-Resource Settings? → EGDT might still help in hospitals without strong sepsis protocols.


7. EGDT vs. ARISE – What Changed?

FeatureEGDT (2001)ARISE (2014)
Required ScvO₂ Monitoring?Yes (central line needed)No (not necessary)
Fluids Given?30 mL/kg guided by CVP30 mL/kg guided by MAP
Vasopressor Use?Only after fluidsStarted earlier if MAP <65
Blood Transfusion?Hct <30%Hb <7 g/dL
Mortality Benefit?Yes (16% reduction in 2001)No difference in 2014

📌 Key Change: EGDT’s invasive monitoring and strict protocol were unnecessary when sepsis care improved overall.


8. Final Take-Home Message

💡 “ARISE confirmed that modern sepsis care (early antibiotics, MAP-guided fluids, and vasopressors) is just as effective as EGDT. The key takeaway? We don’t need central line-driven ScvO₂ monitoring or rigid protocols anymore—what matters most is early resuscitation and individualized fluid management.”


4. PROMISE Trial (2015) – The Final Nail in EGDT’s Coffin

The PROMISE (Protocolized Management in Sepsis) trial, published in The New England Journal of Medicine in 2015, was the third major study—after PROCESS and ARISE—to test whether EGDT improved survival over usual care in early septic shock. Like its predecessors, PROMISE found no survival benefit with EGDT, further cementing the idea that modern sepsis care (early antibiotics, fluid resuscitation, vasopressors) was already optimized without the need for EGDT’s strict protocol.


1. Study Design & Rationale

FeatureDetails
Full NameProtocolized Management in Sepsis (PROMISE)
ObjectiveTo determine whether EGDT improves survival compared to usual care in early septic shock
Study TypeMulticenter, RCT, unblinded, noninferiority trial
Location56 centers (United Kingdom)
Time PeriodFebruary 2011 – July 2014
Number of Patients1,260
SettingEmergency Departments (ED) – patients presenting with early septic shock
Follow-up Duration90 days
Primary Endpoint90-day all-cause mortality

📌 Why Was PROMISE Needed?

  • PROCESS (USA) and ARISE (Australia/NZ) both showed EGDT was not superior to usual care, but further validation was needed in a European healthcare system.
  • It tested whether EGDT’s structured targets (ScvO₂, CVP, dobutamine use) improved survival in an era of early antibiotics and fluid resuscitation.

2. Inclusion & Exclusion Criteria

CriteriaDetails
Inclusion CriteriaSuspected infection + lactate ≥4 mmol/L OR persistent hypotension (MAP <65) after 1L IV fluids
– Must be randomized within 6 hours of ED presentation
Exclusion CriteriaDNR status, pregnancy, acute pulmonary edema, active GI bleeding
>1L IV fluids already given before randomization

📌 Key Similarity to ARISE:

  • Patients were enrolled within 6 hours, just like in ARISE.
  • Early lactate-based screening was emphasized.

3. Intervention Arms & Protocols

FeatureEGDT (Rivers’ Protocol)Usual Care
Fluids (First 6 Hours)30 mL/kg IV crystalloid (CVP-guided)Fluids given at clinician’s discretion
VasopressorsMAP goal ≥65 mmHgMAP goal ≥65 mmHg
ScvO₂ MonitoringYes (≥70%)Not required
Dobutamine UseIf ScvO₂ <70%Rarely used
Blood TransfusionHematocrit <30%Hb <7 g/dL

📌 Key Similarity to PROCESS & ARISE:

  • Usual care already included aggressive early resuscitation, making ScvO₂ monitoring unnecessary.

4. Key Results & Outcomes

4.1 Fluids & Vasopressor Use

Parameter (First 6h)EGDT GroupUsual CareDifference
Total IV Fluids4.0L3.9LNot significantly different
Vasopressors Use (%)53.7%46.6%Slightly more in EGDT group
Dobutamine Use (%)8.0%2.6%More in EGDT group
Blood Transfusion (%)8.9%7.0%More in EGDT group

📌 Key Findings:

  • EGDT patients received slightly more fluids, vasopressors, and dobutamine than usual care.
  • Despite these additional interventions, mortality was the same in both groups.

4.2 Mortality Results

OutcomeEGDTUsual CareDifference
90-Day Mortality29.5%29.2%No significant difference (P = 0.90)
ICU-Free Days13.5 days13.0 daysNo significant difference
Ventilator-Free Days18.2 days18.1 daysNo significant difference

📌 Key Takeaway: EGDT did not improve survival compared to modern usual care.


5. Key Clinical Implications

EGDT’s structured protocol is not superior to modern usual care.
Early antibiotics, aggressive resuscitation, and MAP-guided fluids work just as well.
Routine blood transfusions and dobutamine use are unnecessary.

📌 PROMISE confirmed the findings of PROCESS & ARISE: EGDT is not needed when early sepsis care is optimized.


6. Limitations & Controversies

🔹 Unblinded Study → Clinicians knew which group patients were in, which could introduce bias.
🔹 Better Overall Sepsis Care → The control group received early antibiotics and fluid resuscitation, unlike in 2001 when EGDT was first introduced.
🔹 Does This Apply to Low-Resource Settings? → EGDT might still help in hospitals without strong sepsis protocols.


7. EGDT vs. PROMISE – What Changed?

FeatureEGDT (2001)PROMISE (2015)
Required ScvO₂ Monitoring?Yes (central line needed)No (not necessary)
Fluids Given?30 mL/kg guided by CVP30 mL/kg guided by MAP
Vasopressor Use?Only after fluidsStarted earlier if MAP <65
Blood Transfusion?Hct <30%Hb <7 g/dL
Mortality Benefit?Yes (16% reduction in 2001)No difference in 2015

📌 Key Change: EGDT’s invasive monitoring and strict protocol were unnecessary when sepsis care improved overall.


8. Final Take-Home Message

💡 “PROMISE was the final nail in EGDT’s coffin. It confirmed what PROCESS and ARISE already showed—early antibiotics, MAP-guided fluids, and vasopressors are just as effective as EGDT’s rigid protocol. Today, we focus on individualized resuscitation rather than fixed targets like ScvO₂ and CVP.”


5. CLASSIC Trial (2022) – Liberal vs. Restrictive Fluids in ICU Septic Shock

The CLASSIC (Conservative vs. Liberal Approach to Fluid Therapy in Septic Shock in Intensive Care) trial, published in The New England Journal of Medicine in 2022, was a large, multicenter, randomized controlled trial (RCT) designed to determine whether a restrictive IV fluid strategy improves survival compared to standard (liberal) fluid administration in patients with septic shock in the ICU.

Key Finding: The trial found no significant difference in mortality between restrictive and liberal fluids, suggesting that fluid restriction after initial resuscitation does not improve survival in septic shock.


1. Study Design & Rationale

FeatureDetails
Full NameConservative vs. Liberal Approach to Fluid Therapy in Septic Shock in Intensive Care (CLASSIC)
ObjectiveTo compare restrictive IV fluids vs. usual-care fluid therapy in ICU patients with septic shock
Study TypeMulticenter, RCT, open-label
Location31 ICUs (Denmark, Norway, Sweden, Finland, Switzerland, the UK, and Belgium)
Time PeriodDecember 2018 – September 2021
Number of Patients1,554
SettingICU patients with septic shock who had already received initial fluid resuscitation
Follow-up Duration90 days
Primary Endpoint90-day all-cause mortality

📌 Why Was CLASSIC Needed?

  • Previous studies suggested that excessive IV fluids may worsen outcomes in septic shock by causing fluid overload, pulmonary edema, and organ dysfunction.
  • CLASSIC tested whether a restrictive fluid approach improves survival after initial resuscitation.

📌 Key Difference from CLOVERS:

  • CLOVERS (2023) studied early resuscitation strategies (ED/Wards), whereas CLASSIC (2022) focused on ICU septic shock patients who had already received fluids and vasopressors.

2. Inclusion & Exclusion Criteria

CriteriaDetails
Inclusion CriteriaSeptic shock requiring vasopressors for ≥1 hour
Received at least 1L IV fluids before enrollment
Randomization within 12 hours of septic shock onset
Exclusion CriteriaSeptic shock duration >12 hours
Major bleeding, acute burns, pregnancy, severe dehydration
ICU admission for non-sepsis reasons

📌 Key Difference from CLOVERS: CLASSIC excluded patients in the early resuscitation phase and focused on post-resuscitation fluid management.


3. Intervention Arms & Protocols

FeatureRestrictive Fluid StrategyStandard Fluid Strategy (Liberal Fluids)
Fluids Post-RandomizationMinimal fluids unless clear needFluids given per standard ICU practice
Fluid TriggersFluids only for severe hypoperfusion, oliguria, or marked fluid lossFluids given at clinician discretion
Vasopressor UseEarlier vasopressors instead of fluidsFluids first, then vasopressors if needed
Rescue FluidsAllowed if lactate >4 mmol/L, MAP <50, or ScvO₂ <65%Fluids given more liberally
MonitoringDynamic assessmentsCVP, lactate, bedside clinical signs

📌 Key Difference from CLOVERS: CLASSIC patients were already in septic shock (on vasopressors), while CLOVERS tested early vasopressors vs. liberal fluids in sepsis-induced hypotension.


4. Fluids, Vasopressor Use, and Other Interventions

Parameter (First 24h Post-Randomization)Restrictive GroupStandard Care GroupDifference
Total IV Fluids (First 24h)1,798 mL (IQR: 500–3,000 mL)2,980 mL (IQR: 1,998–4,000 mL)-1,182 mL less in restrictive group
Cumulative Fluids (First 5 Days)1,798 mL3,811 mL-2,013 mL less in restrictive group
Vasopressor Use (%)100% (all required vasopressors at enrollment)100%No difference

📌 Key Findings:

  • The restrictive group received ~1.2L less fluids within 24 hours and ~2L less over 5 days compared to standard care.
  • Both groups used vasopressors equally, suggesting early vasopressors do not necessarily improve survival.

5. Primary & Secondary Outcomes

5.1 Mortality Results

OutcomeRestrictive FluidsStandard FluidsDifference
90-Day Mortality42.3%42.1%No significant difference (P = 0.96)
28-Day Mortality34.5%34.2%No difference

📌 Key Takeaway: Restricting fluids did not improve survival in ICU septic shock.


5.2 Secondary Outcomes

OutcomeRestrictive FluidsStandard FluidsP-Value
Days Alive Without Life Support (Day 90)47 days47 daysNS
Days Alive and Out of Hospital (Day 90)33 days34 daysNS
Serious Adverse EventsNo significant differenceNo significant differenceNS

📌 Key Takeaway: Fluid restriction did not reduce ventilator days, organ failure, or hospital stay.


6. Clinical Implications

Restricting fluids after ICU admission does not improve survival in septic shock.
Early vasopressors do not necessarily reduce mortality.
Fluids should be guided by individual patient needs rather than rigid protocols.

📌 CLASSIC suggests that a restrictive approach is not superior to usual-care fluids. Instead, individualized fluid resuscitation is key.


7. Limitations & Controversies

🔹 Open-Label Study → Clinicians knew which group patients were in, introducing potential bias.
🔹 Exclusion of Severe Hypovolemia → Patients with dehydration or severe fluid losses were excluded, limiting generalizability.
🔹 Did Not Study Early Sepsis → CLASSIC focused on ICU septic shock, not early sepsis (like CLOVERS).


8. CLASSIC vs. CLOVERS – Key Differences

FeatureCLASSIC (2022)CLOVERS (2023)
SettingICU patients already in septic shockEarly sepsis in ED/Wards
InterventionRestrictive fluids vs. usual fluids (ICU phase)Early vasopressors vs. liberal fluids (initial resuscitation)
Key FindingNo survival benefit of fluid restrictionNo survival difference between early vasopressors & liberal fluids

📌 Key Takeaway: CLASSIC and CLOVERS both show that fluid strategy matters less than individualized resuscitation based on patient response.


9. Final Take-Home Message

💡 “CLASSIC showed that restrictive fluids do not improve survival in ICU septic shock. The key takeaway? Individualized fluid management is more important than strict liberal or restrictive strategies.”

6. CLOVERS Trial (2023) – Liberal Fluids vs. Early Vasopressors in Sepsis

The CLOVERS (Crystalloid Liberal or Vasopressors Early Resuscitation in Sepsis) trial, published in The New England Journal of Medicine in 2023, investigated whether an early vasopressor strategy with restricted fluids improves outcomes compared to a liberal fluid strategy in patients with sepsis-induced hypotension.

Key Finding: There was no difference in 90-day mortality between early vasopressors and liberal fluids, suggesting no clear advantage of restricting fluids and starting vasopressors early.


1. Study Design & Rationale

FeatureDetails
Full NameCrystalloid Liberal or Vasopressors Early Resuscitation in Sepsis (CLOVERS)
ObjectiveTo compare early vasopressors with restrictive fluids vs. liberal IV fluids in early sepsis-induced hypotension
Study TypeMulticenter, RCT, unblinded
Location60 centers (USA, National Heart, Lung, and Blood Institute)
Time PeriodMarch 2018 – January 2022
Number of Patients1,563
SettingEmergency Department (ED) and hospital wards – early sepsis before ICU admission
Follow-up Duration90 days
Primary Endpoint90-day all-cause mortality

📌 Why Was CLOVERS Needed?

  • Sepsis guidelines recommend 30 mL/kg IV fluids initially, but the optimal balance between fluids and vasopressors was unclear.
  • Excess fluids can cause organ congestion, but early vasopressors may impair tissue perfusion.
  • CLOVERS tested whether early vasopressors with less fluid resuscitation improves outcomes in early sepsis.

📌 Key Difference from CLASSIC (2022):

  • CLOVERS studied early sepsis in ED/Wards, whereas CLASSIC studied post-resuscitation septic shock in ICU patients.

2. Inclusion & Exclusion Criteria

CriteriaDetails
Inclusion CriteriaSepsis-induced hypotension (MAP <65 mmHg or SBP <100 mmHg) after 1–3L IV fluids
Suspected or confirmed infection
Randomization within 4 hours of meeting criteria
Exclusion CriteriaSeptic shock requiring immediate ICU admission
Severe volume depletion (e.g., GI bleed, pancreatitis)
Active hemorrhage, pregnancy, cardiac arrest, CHF, ESRD on dialysis

📌 Key Inclusion Criteria: Patients were early in sepsis, before ICU admission, with persistent hypotension despite 1–3L IV fluids.

📌 Key Exclusion: Patients already in septic shock (requiring immediate ICU care) were excluded.


3. Intervention Arms & Protocols

FeatureRestrictive Fluids (Early Vasopressors)Liberal Fluids Strategy
Fluids Post-RandomizationMinimal fluids unless severe hypoperfusionAggressive fluid resuscitation (goal 30 mL/kg)
VasopressorsEarly norepinephrine infusion if MAP <65Started only if fluids failed to restore MAP
Fluid Rescue TriggersFluids only for lactate >4 mmol/L, severe oliguria, persistent shockFluids given as first-line therapy
MonitoringFrequent reassessment for tissue perfusionFluids given until perfusion improved

📌 Key Difference from CLASSIC:

  • CLOVERS patients were pre-ICU, testing fluid restriction in early sepsis.
  • CLASSIC patients were already in septic shock (ICU phase) and had received initial resuscitation.

4. Fluids, Vasopressor Use, and Other Interventions

Parameter (First 24h Post-Randomization)Restrictive (Early Vasopressors)Liberal FluidsDifference
Total IV Fluids (First 24h)1267 mL (IQR: 555–2279 mL)3400 mL (IQR: 2500–4495 mL)-2,133 mL less in restrictive group
Cumulative Fluids (First 5 Days)3300 mL5400 mL-2,100 mL less in restrictive group
Vasopressor Use (%)59%37%Earlier and more common in restrictive group

📌 Key Findings:

  • The restrictive group received ~2L less fluids within 24 hours and ~2.1L less over 5 days.
  • Earlier vasopressors were used in 59% of restrictive patients vs. 37% in the liberal group.

5. Primary & Secondary Outcomes

5.1 Mortality Results

OutcomeRestrictive FluidsLiberal FluidsDifference
90-Day Mortality14.0%14.9%No significant difference (P = 0.61)
28-Day Mortality10.3%11.3%No significant difference

📌 Key Takeaway: Restricting fluids and using early vasopressors did not improve survival in early sepsis.


5.2 Secondary Outcomes

OutcomeRestrictive FluidsLiberal FluidsP-Value
Days Free from Organ Support (Day 28)21 days21 daysNS
Ventilator-Free Days23.4 days22.8 daysNS
ICU Length of Stay6.5 days6.7 daysNS
Serious Adverse Events10.6%10.5%NS

📌 Key Takeaway: No difference in ventilator days, ICU stay, or organ failure between groups.


6. Clinical Implications

Restricting fluids in early sepsis does not improve survival.
Early vasopressors are safe but offer no mortality benefit over liberal fluids.
Sepsis resuscitation should be individualized rather than following rigid protocols.

📌 CLOVERS suggests that both fluid-first and early vasopressor-first approaches are reasonable, emphasizing the need for individualized resuscitation.


7. Limitations & Controversies

🔹 Unblinded Study → Clinicians knew which group patients were in, introducing potential bias.
🔹 Excluded ICU Septic Shock PatientsResults do not apply to patients already in severe septic shock.
🔹 Low Vasopressor Use in Restrictive Group → Only 59% received vasopressors, raising concerns about protocol adherence.


8. CLOVERS vs. CLASSIC – Key Differences

FeatureCLOVERS (2023)CLASSIC (2022)
SettingEarly sepsis (ED/Wards, pre-ICU)Septic shock (ICU, post-resuscitation)
InterventionRestrictive fluids with early vasopressors vs. liberal fluidsRestrictive fluids vs. usual fluids
Key FindingNo survival difference between fluid-first and vasopressor-firstNo survival benefit of fluid restriction in ICU septic shock

📌 Key Takeaway: Both trials emphasize individualized fluid management over rigid strategies.


9. Final Take-Home Message

💡 “CLOVERS showed that early vasopressors are not superior to liberal fluids in early sepsis resuscitation. The key takeaway? Sepsis resuscitation should be individualized, balancing fluids and vasopressors based on patient needs.”


7. FACTT Trial (2006) – Liberal vs. Conservative Fluids in ARDS

The FACTT (Fluid and Catheter Treatment Trial), published in The New England Journal of Medicine in 2006, was a landmark study that investigated whether a liberal or conservative fluid strategy improved outcomes in patients with acute respiratory distress syndrome (ARDS).

Key Finding: A conservative fluid strategy improved lung function, reduced ventilator days, and shortened ICU stays—without increasing shock or worsening organ perfusion.


1. Study Design & Rationale

FeatureDetails
Full NameFluid and Catheter Treatment Trial (FACTT)
ObjectiveTo compare liberal vs. conservative fluid management strategies in ARDS
Study TypeMulticenter, RCT, 2×2 factorial design
Location20 ARDS Network hospitals (USA)
Time PeriodJune 2000 – October 2005
Number of Patients1,000
SettingICU patients with ARDS (ventilated)
Follow-up Duration60 days
Primary Endpoint60-day mortality

📌 Why Was FACTT Needed?

  • ARDS is a severe lung injury often caused by sepsis, pneumonia, or trauma, with high mortality (~40%).
  • Fluid overload worsens pulmonary edema and oxygenation, but aggressive fluid removal could impair perfusion.
  • FACTT tested whether a conservative fluid strategy could improve lung function without harming circulation.

📌 Key Unique Feature:

  • FACTT used a 2×2 factorial design, testing fluid strategies (liberal vs. conservative) AND catheter monitoring (CVP vs. PA catheter).
  • However, the PA catheter results were neutral, so the main focus was liberal vs. conservative fluid management.

2. Inclusion & Exclusion Criteria

CriteriaDetails
Inclusion CriteriaARDS diagnosis (PaO₂/FiO₂ ≤ 300 mmHg, bilateral infiltrates, non-cardiogenic cause)
Mechanical ventilation required
Randomization within 48 hours of ARDS onset
Exclusion CriteriaSevere CHF, chronic lung disease, CKD, cirrhosis
High risk of volume depletion (GI bleeding, acute pancreatitis)

📌 Key Inclusion: Patients had confirmed ARDS and required ventilation.

📌 Key Exclusion: Severe CHF and CKD patients were excluded to avoid confounding due to volume status.


3. Intervention Arms & Protocols

FeatureConservative FluidsLiberal Fluids
Daily Fluid GoalMaintain CVP <4 mmHgMaintain CVP 10–14 mmHg
Diuretic UseAggressive diuresis allowedMinimal diuretics
Vasopressor UseAllowed if needed to maintain MAPFluids first, then vasopressors if needed
MonitoringCVP or PA catheter to guide fluidsSame

📌 Key Difference: The conservative group received fewer fluids and more diuretics to actively remove excess fluid, while the liberal group received fluids to maintain higher CVP.


4. Fluids, Vasopressor Use, and Other Interventions

Parameter (First 7 Days Post-Randomization)Conservative FluidsLiberal FluidsDifference
Total IV Fluids (7 days)1.0L (median)7.0L (median)-6.0L less in conservative group
Fluid Balance (7 days)-136 mL (net fluid loss)+6,992 mL (net fluid gain)~7L difference
Diuretic Use (%)68%21%More frequent in conservative group
Vasopressor Use (%)66%57%Slightly more in conservative group

📌 Key Findings:

  • The conservative group received 6L less fluids over 7 days and had a net negative fluid balance.
  • Vasopressors were used slightly more in the conservative group but without harm.

5. Primary & Secondary Outcomes

5.1 Mortality Results

OutcomeConservative FluidsLiberal FluidsDifference
60-Day Mortality25.5%28.4%No significant difference (P = 0.30)
ICU Mortality16.9%19.7%No significant difference

📌 Key Takeaway: Conservative fluids did NOT reduce mortality compared to liberal fluids.


5.2 Secondary Outcomes

OutcomeConservative FluidsLiberal FluidsP-Value
Ventilator-Free Days (Day 28)14.6 days12.1 daysP < 0.001
ICU-Free Days (Day 28)13.4 days11.2 daysP < 0.001
Oxygenation (PaO₂/FiO₂ at Day 7)+23 mmHg improvementNo significant changeP < 0.001
Acute Kidney Injury (AKI)10%14%P < 0.05 (fewer AKI in conservative group)

📌 Key Takeaway: Conservative fluids improved lung function, reduced ventilator days, and lowered ICU stay without increasing AKI.


6. Clinical Implications

A conservative fluid strategy improves lung function and shortens ICU stay in ARDS.
Conservative fluids reduce ventilator days without harming circulation.
Excess fluids worsen lung function, oxygenation, and ICU outcomes.

📌 FACTT changed ARDS management by promoting conservative fluids and diuresis.


7. Limitations & Controversies

🔹 Did Not Assess Long-Term Outcomes → Follow-up was limited to 60 days.
🔹 Excluded Severe Hypovolemia → Results may not apply to septic shock patients needing aggressive fluids.
🔹 Higher Vasopressor Use in Conservative Group → More patients required vasopressors, though this did not worsen mortality.


8. FACTT vs. CLOVERS & CLASSIC – Key Differences

FeatureFACTT (2006)CLOVERS (2023)CLASSIC (2022)
SettingICU patients with ARDSEarly sepsis (ED/Wards)ICU septic shock
InterventionRestrictive vs. Liberal fluids in ARDSEarly vasopressors vs. fluids in sepsisRestrictive vs. usual fluids in septic shock
Key FindingRestrictive fluids improved lung function & reduced ICU stayNo survival benefit of early vasopressorsNo survival benefit of fluid restriction

📌 Key Takeaway: FACTT supports conservative fluids in ARDS, while CLOVERS & CLASSIC suggest individualized fluid management in sepsis.


9. Final Take-Home Message

💡 “FACTT revolutionized ARDS management by proving that conservative fluid strategies improve lung function, reduce ventilator days, and shorten ICU stay—without increasing mortality. The key takeaway? Avoid fluid overload in ARDS and use diuresis when needed.”


8. ANDROMEDA-SHOCK (2019) – Capillary Refill vs. Lactate-Guided Resuscitation in Sepsis

The ANDROMEDA-SHOCK trial, published in JAMA in 2019, was a multicenter randomized controlled trial (RCT) designed to compare capillary refill time (CRT)-guided resuscitation vs. lactate clearance-guided resuscitation in patients with septic shock.

Key Finding: CRT-guided resuscitation led to less fluid administration and faster resolution of shock, without increasing mortality.


1. Study Design & Rationale

FeatureDetails
Full NameANDROMEDA-SHOCK (ANDROmeda Sepsis SHOCK)
ObjectiveTo compare capillary refill time (CRT) vs. lactate clearance for guiding fluid resuscitation in septic shock
Study TypeMulticenter, RCT, open-label
Location28 ICUs (Argentina, Chile, Colombia, Ecuador, Uruguay)
Time PeriodMarch 2017 – March 2018
Number of Patients424
SettingICU patients with septic shock
Follow-up Duration28 days
Primary Endpoint28-day all-cause mortality

📌 Why Was ANDROMEDA-SHOCK Needed?

  • Septic shock resuscitation traditionally relied on lactate clearance to guide fluids and vasopressors, but lactate is slow to normalize and affected by non-hypoperfusion factors (e.g., liver dysfunction).
  • Capillary refill time (CRT) is a simple bedside test that reflects microcirculatory perfusion and responds more rapidly to changes in circulation.
  • ANDROMEDA-SHOCK tested whether CRT-guided resuscitation could reduce fluid overload while maintaining adequate perfusion.

📌 Key Novel Feature:

  • First major RCT to test CRT vs. lactate as a bedside tool for guiding resuscitation in septic shock.

2. Inclusion & Exclusion Criteria

CriteriaDetails
Inclusion CriteriaSeptic shock requiring vasopressors after ≥20 mL/kg IV fluids
Lactate ≥2 mmol/L
Exclusion CriteriaAcute hemorrhage, severe trauma, acute pulmonary edema, DNR status
Severe liver failure (Child-Pugh C), chronic kidney disease (CKD), pregnancy

📌 Key Inclusion: Patients had persistent septic shock despite initial fluid resuscitation.

📌 Key Exclusion: Conditions where CRT or lactate might be unreliable (e.g., liver failure, acute bleeding).


3. Intervention Arms & Protocols

FeatureCRT-Guided ResuscitationLactate-Guided Resuscitation
Perfusion TargetCRT ≤3 secondsLactate decrease by ≥20% every 2 hours
Fluids (After Randomization)Fluids stopped if CRT normalizedFluids continued if lactate remained high
Vasopressor UseAdjusted based on CRT responseAdjusted based on lactate response
MonitoringReassessed every 30 minutesLactate rechecked every 2 hours

📌 Key Difference: CRT was reassessed every 30 minutes (fast response), while lactate took longer (every 2 hours).


4. Fluids, Vasopressor Use, and Other Interventions

Parameter (First 8h Post-Randomization)CRT-Guided GroupLactate-Guided GroupDifference
Total IV Fluids (8h)1.4L (IQR: 0.9–2.1L)1.8L (IQR: 1.2–2.6L)-400 mL less in CRT group
Cumulative Fluids (First 24h)2.4L3.2L-800 mL less in CRT group
Vasopressor Use (%)Higher in CRT group (faster escalation to norepinephrine)Delayed vasopressors in lactate group

📌 Key Findings:

  • The CRT group received ~400 mL less fluids in 8 hours and ~800 mL less over 24 hours.
  • CRT-guided resuscitation resulted in earlier vasopressor use but less fluid administration.

5. Primary & Secondary Outcomes

5.1 Mortality Results

OutcomeCRT-Guided ResuscitationLactate-Guided ResuscitationDifference
28-Day Mortality34.9%43.4%No significant difference (P = 0.06)

📌 Key Takeaway: CRT-guided resuscitation did not significantly reduce mortality, but there was a trend toward benefit (P = 0.06).


5.2 Secondary Outcomes

OutcomeCRT-Guided ResuscitationLactate-Guided ResuscitationP-Value
Organ Failure-Free Days14.5 days13.0 daysP = 0.045
ICU-Free Days10.0 days8.5 daysP = 0.04
Vasopressor-Free Days17.0 days15.0 daysP = 0.04
Ventilator-Free Days16.5 days14.0 daysP = 0.03

📌 Key Takeaway: CRT-guided resuscitation led to faster shock resolution, fewer organ failures, and earlier ICU discharge.


6. Clinical Implications

CRT is a simple bedside tool that rapidly reflects tissue perfusion.
CRT-guided resuscitation reduced fluid administration and improved organ recovery.
Lactate clearance alone may lead to excessive fluid resuscitation.

📌 ANDROMEDA-SHOCK suggests that CRT should be included in septic shock resuscitation strategies.


7. Limitations & Controversies

🔹 Underpowered for Mortality → The trial was not powered to detect mortality differences (P = 0.06 trend toward CRT benefit).
🔹 Open-Label Design → Clinicians knew the resuscitation strategy, potentially influencing decisions.
🔹 Excluded Severe Hypovolemia → Results may not apply to patients needing aggressive volume resuscitation.


8. ANDROMEDA-SHOCK vs. PROCESS, ARISE, PROMISE – Key Differences

FeatureANDROMEDA-SHOCK (2019)PROCESS (2014)ARISE (2014)PROMISE (2015)
SettingICU patients with septic shockEarly sepsis (ED/Wards)Early sepsis (ED/Wards)Early sepsis (ED/Wards)
InterventionCRT vs. lactate for resuscitationEGDT vs. usual careEGDT vs. usual careEGDT vs. usual care
Key FindingCRT led to faster shock resolution with less fluidsEGDT not superior to usual careEGDT not superior to usual careEGDT not superior to usual care

📌 Key Takeaway: ANDROMEDA-SHOCK showed that CRT is a fast, effective bedside tool for guiding resuscitation, while prior sepsis trials focused on structured protocols vs. usual care.


9. Final Take-Home Message

💡 “ANDROMEDA-SHOCK proved that capillary refill time is a simple, rapid, and effective bedside tool for resuscitation in septic shock. CRT-guided resuscitation reduces fluid overload and improves organ recovery—without compromising perfusion.”


CLOVERS vs. CLASSIC Trial: Detailed Comparison

Both CLOVERS (2023) and CLASSIC (2022) are major randomized controlled trials that investigated restrictive vs. liberal fluid resuscitation strategies in septic shock. However, they differ in patient population, timing of intervention, volume of fluids given, and outcomes.


1. Study Design & Objectives

FeatureCLOVERS Trial (2023)CLASSIC Trial (2022)
Full NameCrystalloid Liberal or Vasopressors Early Resuscitation in SepsisConservative vs. Liberal Approach to Fluid Therapy in Septic Shock
ObjectiveEarly resuscitation: Compare restrictive (early vasopressors) vs. liberal (more fluids) approach in sepsis-induced hypotensionICU fluid management: Compare restrictive vs. standard care in septic shock patients already admitted to the ICU
Study TypeMulticenter, RCT, open-labelMulticenter, RCT, open-label
Location60 centers (USA)31 ICUs (Europe)
Patients IncludedSepsis-induced hypotension (early phase, pre-ICU)Septic shock in ICU (post-initial resuscitation phase)
Timing of InterventionEarly septic shock (ED & wards, within 4h of meeting criteria)Late septic shock (ICU, after initial resuscitation)
Primary HypothesisEarly vasopressors with restrictive fluids improves survivalRestricting fluids after ICU admission improves survival

🔹 Key Difference:

  • CLOVERS studied early sepsis resuscitation (first few hours in ED/Wards).
  • CLASSIC studied post-resuscitation phase (ICU patients who had already received fluids).

2. Inclusion & Exclusion Criteria

FeatureCLOVERSCLASSIC
Inclusion CriteriaSuspected infection + hypotension after 1–3L fluids (MAP <65 mmHg, SBP <100 mmHg)Septic shock requiring vasopressors after receiving ≥1L of IV fluids
Exclusion Criteria>4h since hypotension, >3L fluids given, severe fluid overload, pregnancy>12h septic shock, >4L fluids before enrollment, major bleeding, severe burns

🔹 Key Difference:

  • CLOVERS patients were in the early hours of sepsis.
  • CLASSIC patients were already admitted to ICU and receiving vasopressors.

3. Intervention Protocols

FeatureCLOVERSCLASSIC
Restrictive Fluids Group– Fluids limited after initial 1–3L
– Early vasopressors started to maintain MAP
– Fluids minimized after ICU admission
– Additional fluids given only if signs of hypoperfusion
Liberal/Standard Fluids Group– Initial 2L fluid bolus, then fluids as needed
– Vasopressors started only if fluids failed
– Fluids given at clinician discretion (standard ICU practice)

🔹 Key Difference:

  • CLOVERS: Tested early vasopressor use vs. aggressive fluids.
  • CLASSIC: Tested ongoing restrictive fluids vs. usual care in ICU patients already on vasopressors.

4. Fluids and Vasopressor Use

FeatureCLOVERS RestrictiveCLOVERS LiberalCLASSIC RestrictiveCLASSIC Standard
Fluids in First 6h500 mL (IQR: 130–1097)2300 mL (IQR: 2000–3000)1798 mL (IQR: 500–3000)2980 mL (IQR: 1998–4000)
Fluids in First 24h1267 mL (IQR: 555–2279)3400 mL (IQR: 2500–4495)1798 mL (IQR: 500–3000)2980 mL (IQR: 1998–4000)
Total Fluids (including pre-trial fluids)3300 mL5400 mL4900 mL5700 mL
Vasopressor Use59%37%100% (all required vasopressors at enrollment)100%

🔹 Key Difference:

  • CLOVERS: Liberal group got ~2L more fluids within 6h; restrictive group got earlier vasopressors.
  • CLASSIC: Both groups were on vasopressors; restrictive fluids led to ~1L less fluid over 24h.

5. Outcomes & Mortality

OutcomeCLOVERS RestrictiveCLOVERS LiberalCLASSIC RestrictiveCLASSIC Standard
90-Day Mortality14.0%14.9%42.3%42.1%
Ventilator-Free Days23.4 days22.8 days19.3 days19.5 days
ICU-Free Days (28d)22.8 days22.7 days12.5 days13.0 days
RRT Use3.3%3.3%22.5%20.8%
Serious Adverse Events10.6%10.5%No difference

🔹 Key Takeaways:

  • Neither trial found a significant mortality difference between restrictive and liberal fluids.
  • Restricting fluids did NOT improve survival in either early sepsis (CLOVERS) or ICU septic shock (CLASSIC).
  • CLASSIC showed slightly fewer ventilator-free days with restrictive fluids, but this was not statistically significant.

6. Clinical Implications & Take-Home Messages

Key Similarities Between CLOVERS & CLASSIC:

Restricting fluids does not improve survival.
Liberal fluids do not significantly increase harm.
Early vasopressors are safe but not clearly superior.
Both trials suggest that individualized fluid management is the best approach.

Key Differences Between CLOVERS & CLASSIC:

🔹 CLOVERS tested early resuscitation (first few hours), CLASSIC tested ICU patients post-resuscitation.
🔹 CLOVERS tested early vasopressors vs. fluids, CLASSIC tested post-resuscitation fluid restriction.
🔹 CLOVERS patients received less fluid overall; CLASSIC patients were already on vasopressors.


7. Final Take-Home Message

💡 “CLOVERS and CLASSIC both show that restrictive fluid strategies do not improve survival in septic shock. CLOVERS tested early vasopressors in ED patients, while CLASSIC tested fluid restriction in ICU patients. The key takeaway? Individualized fluid therapy based on dynamic assessment is more important than strict liberal vs. restrictive strategies.”

Posted in Medical | Tagged: , , , , , , | Leave a Comment »

Navigating Antibiotic Choices in the Face of Diverse Carbapenemase-Producing Enterobacteriaceae

Posted by Dr KAMAL DEEP on April 23, 2024

Navigating Antibiotic Choices in the Face of Diverse Carbapenemase-Producing Enterobacteriaceae

The landscape of antibiotic resistance among Gram-negative bacteria, particularly Carbapenemase-Producing Enterobacteriaceae (CPE), presents significant clinical challenges that require nuanced understanding of both the molecular mechanisms of resistance and the regional epidemiology influencing these mechanisms.

Ceftazidime-avibactam is the preferred choice for infections caused by Enterobacteriaceae harboring OXA-48-like enzymes. The efficacy of this combination is attributed to avibactam’s robust inhibition of OXA-48-like carbapenemases, which enhances the bactericidal activity of ceftazidime.

For NDM-producing Enterobacteriaceae, which often produce class B metallo-β-lactamases (MBLs), recommended treatments include ceftazidime-avibactam plus aztreonam or cefiderocol monotherapy. Notably, aztreonam is resistant to hydrolysis by NDM and other MBLs, but its effectiveness is compromised by co-produced β-lactamases like ESBLs, AmpC, KPCs, or OXA-48-like enzymes. Here, avibactam’s inhibition of these additional β-lactamases restores aztreonam’s activity, making this combination especially valuable in regions with a high prevalence of MBLs.

In the treatment of KPC-producing infections, meropenem-vaborbactam, ceftazidime-avibactam, and imipenem-cilastatin-relebactam are preferred, leveraging their potent activity against class A carbapenemases. Among these, meropenem-vaborbactam is slightly favored based on clinical outcomes and the relative emergence of resistance, as evidenced by available data.

Aztreonam, specifically, is stable against hydrolysis by class B MBLs like NDM, which positions it as a crucial agent against MBL producers. However, its utility is limited when these pathogens co-produce other β-lactamases that can degrade aztreonam. Avibactam, a broad-spectrum β-lactamase inhibitor, counters this by inhibiting serine β-lactamases such as ESBLs, AmpC, KPC, and OXA-48-like enzymes. This dual inhibition mechanism not only targets robust MBLs but also other co-produced β-lactamases, thus broadening the therapeutic efficacy of aztreonam against resistant strains.

It’s important to consider the global distribution of carbapenemases: β-lactam–β-lactamase inhibitor (βL-βLI) combinations like ceftazidime-avibactam and meropenem-vaborbactam are effective against class A carbapenemases such as KPC but are generally ineffective against class B MBLs, including NDMs. The Asian continent, with an estimated 60% of global NDM producers, exemplifies a region where these βL-βLI combinations would be less useful, highlighting the need for alternative therapies in such settings.

The investigational aztreonam-avibactam combination promises efficacy in treating infections that involve both MBLs and other β-lactamases. The dual inhibition mechanism not only targets the robust MBLs but also counters the resistance posed by co-produced β-lactamases, offering a potential therapeutic advantage in regions heavily impacted by these resistance factors.

Understanding the epidemiology of specific carbapenemase genes is critical. Dual carbapenemase carriage, typically NDM co-occurring with KPC or OXA-48-like carbapenemases, is not uncommon and requires astute clinical insight into local resistance patterns for effective treatment planning.

This deep dive into the molecular and epidemiological aspects of carbapenemase production underscores the necessity for tailored antibiotic strategies that align with regional resistance profiles. Effective management of CPE infections depends on the continued advancement of diagnostic capabilities, therapeutic interventions, and an acute awareness of the geographic distribution of carbapenemase genes.

Antimicrobial stewardship is crucial for managing the use of novel antibiotics, particularly in the context of complex infections caused by carbapenemase-producing Enterobacteriaceae (CPE). Stewardship efforts aim to ensure judicious use of these potent drugs to avoid treating patients who are merely colonized rather than infected. This distinction is vital, as inappropriate use of broad-spectrum antibiotics can lead to unnecessary treatment, increased healthcare costs, and the acceleration of antibiotic resistance.

Effective stewardship involves tailoring antibiotic therapy based on precise microbial identification and susceptibility testing, optimizing dosing regimens to maximize efficacy while minimizing toxicity, and shortening the duration of therapy to the necessary minimum. By adhering to these principles, healthcare providers can preserve the effectiveness of current treatment options, safeguard patient outcomes, and reduce the overall burden of antibiotic resistance.

Posted in Medical | Tagged: | Leave a Comment »

Title: Empowering Tomorrow’s Healers: The Transformative Role of Big Data in Precision Medicine

Posted by Dr KAMAL DEEP on August 3, 2023

Process

International Congress on Human-Computer Interaction, Optimization and Robotic Applications (HORA) – Importance of Big Data in Precision and Personalized Medicine. , (), 1–6.doi:10.1109/HORA49412.2020.9152842

“One of the very few silver linings about me getting sick is that Reed’s gotten to spend a lot of time studying with some very good doctors… I think the biggest innovations of the twenty-first century will be the intersection of biology and technology. A new era is beginning, just like the digital one when I was his age.” –Steve Jobs (from his biography, Steve Jobs)

Introduction:
As aspiring medical professionals, the journey of becoming a healer is marked by endless learning and unwavering dedication to patient care. In the dynamic landscape of modern medicine, a revolutionary force is reshaping the way we approach healthcare – precision medicine. At the heart of this transformative approach lies the vast reservoir of information known as big data. In this blog, we will explore how big data is empowering medicine students like you, equipping you with the tools to provide personalized, targeted treatments, and revolutionizing patient care.

  1. Embracing the Age of Information:
    In the era of big data, the sheer volume of medical information available can be overwhelming. However, for medical students, it presents an unprecedented opportunity to deepen your understanding of diseases, treatments, and patient outcomes. By leveraging big data analytics, you can explore intricate patterns and correlations that would have been impossible to grasp using traditional methods.
  2. Personalizing Patient Care:
    As medicine students, you have probably witnessed how patients respond differently to treatments. Precision medicine, fueled by big data, seeks to unravel the molecular and genetic underpinnings of these variations. Armed with this knowledge, you will be able to design personalized treatment plans, optimizing efficacy while minimizing adverse effects.
  3. Advancing Diagnostic Precision:
    One of the pillars of precision medicine is early and accurate diagnosis. With the vast array of data at your disposal, you can delve deeper into the intricacies of diseases, identifying subtle biomarkers and genetic signatures. This level of diagnostic precision holds the potential to revolutionize patient outcomes and save lives.
  4. Unlocking the Secrets of Complex Diseases:
    As future medical professionals, you are no strangers to the challenges posed by complex diseases like cancer and neurological disorders. Big data offers a key to unlocking their secrets. By harnessing this data, you can explore the multifactorial nature of these conditions, paving the way for targeted therapies and groundbreaking research.
  5. Bridging the Gap Between Research and Practice:
    The integration of big data into precision medicine bridges the gap between research and clinical practice. As medicine students, you can actively contribute to this vital process by engaging in data-driven research, translating cutting-edge discoveries into tangible improvements in patient care.
  6. Ethical Considerations and Patient Privacy:
    With the immense power of big data comes an equal responsibility to uphold ethical standards and protect patient privacy. As you navigate the world of precision medicine, it is essential to prioritize the ethical use and handling of patient information, ensuring that the potential benefits outweigh any potential risks.

Conclusion:
As medicine students, you are poised to embark on a transformative journey, shaping the future of healthcare through the lens of precision medicine and big data. The wealth of information at your disposal holds the promise of personalized patient care, diagnostic accuracy, and breakthroughs in understanding complex diseases. Embrace the opportunities presented by big data, and let it be a guiding light in your pursuit of becoming tomorrow’s compassionate and data-savvy healers. Together, we can revolutionize patient care and create a healthier and more resilient world.

Posted in Medical | Leave a Comment »

Time Constant of Lungs

Posted by Dr KAMAL DEEP on July 31, 2023

“Time constant, the silent conductor of the cosmic orchestra, conducting the symphony of life’s harmonies, bridging the past and future, as each note of the present moment unfurls into the eternal melody of existence.” ⌛🎵

In physics and engineering, the time constant, usually denoted by the Greek letter τ (tau), is the parameter characterizing the response to a step input of a first-order, linear time-invariant (LTI) system. The time constant is the main characteristic unit of a first-order LTI system.

If, instead of curving exponentially and slowing its rate of decay, the function continued to decay at the same rate as it had at Time Zero, it would obviously reach the bottom rather quickly. The time it would take to reach the bottom is one time constant. Because this happens to be an exponential curve (using the base of natural logarithms, e), after one time constant the function has decreased to 37% of its initial value (i.e. it has decreased by 63%). Thus, one might say that the time constant is

“A time which represents the speed with which a particular system can respond to change, typically equal to the time taken for a specified parameter to vary by a factor of 1− 1/ e “

Concept:

  • The time constant is defined as the measure of time required for certain changes in voltages and currents in RC and RL circuits.
  • The elapsed time exceeds five-time constants (5τ) after switching has occurred, the currents and voltages have reached their final value, which is also called steady-state response
  • A Pulse is a voltage or current that changes from one level to another and back again. If a waveform’s high time equals its low time it is called a square wave. The length of each cycle of a pulse is its period 
  • A short time constant is defined as no more than one-fifth the pulse width, in time, for the applied voltage.

Example 1: Imagine you have a toy car that can go faster or slower when you press a button. The time constant is like how quickly the toy car gets to the right speed after you press the button. If it takes a long time, it’s slow. If it happens quickly, it’s fast. So, time constant tells us how fast or slow something happens in a special way! 🚗⏱️

Example 2: Imagine you have a magic potion that you use to grow a plant. The time constant is like how quickly the plant grows after you pour the potion on it. If it takes a long time, the plant grows slowly, and if it happens quickly, the plant grows fast. So, the time constant helps us understand how fast or slow things change or develop in a special way! 🌱⏱️

Example 3: Imagine you have a smart home with a thermostat that adjusts the room temperature. The time constant is like the speed at which the thermostat reaches the desired temperature after you change it. If it takes a long time, the temperature changes slowly, and if it happens quickly, the temperature changes fast. So, the time constant gives you an idea of how responsive the system is to changes, whether it’s in a technical circuit or any other dynamic system! 🏠🌡️⏱️

Example 4: When you have a dynamic system, like an electronic circuit or a chemical reaction, the time constant measures how quickly it responds to changes. It’s like a special “reaction speed” parameter. For instance, in an RC circuit, it’s determined by multiplying the resistance and capacitance values. A larger time constant means the system responds slowly to changes, and a smaller time constant means it reacts quickly. Understanding the time constant helps engineers and scientists predict and control how systems behave in real-world situations. 📊⏱️🔌

Example 5: The time constant is a significant concept used in physics and engineering to analyze dynamic systems. It represents the time it takes for a system to reach approximately 63.2% of its final or steady-state value after a sudden change in input.

In various applications, such as electrical circuits, mechanical systems, and chemical processes, understanding the time constant is essential for predicting the system’s response to changes and disturbances. A higher time constant implies a slower response, while a lower time constant indicates a quicker response.

By knowing the time constant, engineers and scientists can optimize and control system behavior, ensuring stability and efficiency in a wide range of real-world situations. 🕰️⏱️🔌🚀

The defining properties of any LTI system are linearity and time invariance.

  • Linearity means that the relationship between the input x(t)x(t) and the output y(t)y(t), both being regarded as functions, is a linear mapping: If aa is a constant then the system output to ax(t){\displaystyle ax(t)}is ay(t){\displaystyle ay(t)}; if x′(t)x'(t) is a further input with system output y′(t)y'(t)then the output of the system to x(t)+x′(t){\displaystyle x(t)+x'(t)} is y(t)+y′(t){\displaystyle y(t)+y'(t)}, this applying for all choices of aa,x(t), x′(t)x'(t). The latter condition is often referred to as the superposition principle.
  • Time invariance means that whether we apply an input to the system now or T seconds from now, the output will be identical except for a time delay of Tseconds. That is, if the output due to input x(t)x(t) is y(t)y(t), then the output due to input x(t−T)x(t-T) is y(t−T)y(t-T). Hence, the system is time invariant because the output does not depend on the particular time the input is applied.

Physically, the time constant represents the elapsed time required for the system response to decay to zero if the system had continued to decay at the initial rate, because of the progressive change in the rate of decay the response will have actually decreased in value to 1 /e ≈ 36.8%in this time (say from a step decrease). In an increasing system, the time constant is the time for the system’s step response to reach 1 − 1 /e ≈ 63.2%of its final (asymptotic) value (say from a step increase). In radioactive decay the time constant is related to the decay constant (λ), and it represents both the mean lifetime of a decaying system (such as an atom) before it decays, or the time it takes for all but 36.8% of the atoms to decay. For this reason, the time constant is longer than the half-life, which is the time for only 50% of the atoms to decay.

The Time Constant of the lung (TC) is a concept borrowed from electrical engineering (as explained above) which describes the phenomenon whereby a given percentage of a passively exhaled breath of air will require a constant amount of time to be exhaled regardless of the starting volume given constant lung mechanics. That’s quite a mouth-full of a definition but consider what determines how long it takes to exhale a tidal breath passively. At the start of exhalation, the initial flow of gas out of the lung depends upon the driving pressure (i.e. alveolar pressure – mouth pressure) and it depends on the airway resistance. For any given volume of gas, the alveolar pressure at the start of exhalation is only dependent upon the lung compliance. Mathematically, the time constant is defined as compliance multiplied by the airway resistance and the resulting value has units of seconds of time.

  • Time constant (τ) is the time required for inflation up to 63% of the final volume, or deflation by 63% 
  • It is the product of resistance and compliance
  • For a normal set of lungs as a whole, the time constant is 0.1-0.2 seconds

The time constant determines the length of time needed for a passive exhalation and that the time constant is the product of airway resistance and lung compliance. The lower the compliance, the higher the driving pressure pushing gas out of the lungs during exhalation; the lower the resistance, the higher the expiratory flow rate can be when driven by the alveolar pressure. If the time constant is known (or can be estimated) then the maximum mechanical respiratory rate that can be used before Auto PEEP results can be estimated. Consider that at least 3 time constants are required to exhale passively any volume of gas. The combination of inspiratory and expiratory time leads to a give respiratory rate such that:


Total Breath Time = Insp time + Exp time


Respiratory Rate = 60 / Total Breath Time


Maximum Rate = 60 / (Insp time + 3 x TC)


A patient with a compliance of 0.05 L/cm H20 and an airway resistance of 30 cm H20/L/sec. This would give a time constant of 1.5 seconds. A complete exhalation would take around 4.5 seconds. If inspiratory time is 1 second then total breath time is 5.5 seconds and the maximum respiratory rate without gas trapping would be 11 breaths per minute. When gas trapping occurs, the functional residual capacity (FRC) is increased. As the FRC increases, the alveolar pressure increases by an amount of pressure determined by the patient’s lung compliance. As the FRC rises in relation to the total lung capacity (TLC), the lung compliance will decrease. This decrease in lung compliance shortens the time constant for the next breath and thus shortens the time required to exhale the next breath and lessens the amount of trapping that will occur with each subsequent breath until the time constant shortens enough that gas trapping no longer occurs. When this steady state is reached, the FRC is at its maximum and the auto-PEEP is also at its maximum. This fact gives us a way to measure how much auto-PEEP exists since we can serially measure exhaled tidal volumes and then interrupt ventilation (by turning the respiratory rate to zero for several seconds) and measuring how much gas the patient exhales as the patient exhales back to the FRC level that existed prior to ventilation. If we take the difference between the exhaled volume during ventilation and the exhaled volume after interrupting ventilation then we have the amount of gas that was trapped. If we divide this volume by the lung compliance we will have calculated the amount of auto-PEEP applied to the alveoli during ventilation. Normally we are more interested in avoiding auto-PEEP than in measuring it though there are many patients in whom it cannot be avoided so it is useful to be able to quantitate it. Another way to detect auto-PEEP is to watch a patient’s chest movement and/or breath sounds during exhalation to see if exhalation stops prior to initiation of inspiration by the ventilator. If exhalation doesn’t finish then auto-PEEP is occurring. When exhaled tidal volumes cannot be measured (which is seldom with modern ventilators) the level of auto-PEEP can be very roughly estimated by interrupting exhalation just prior to initiation of inspiration and watching to see if there is a pressure increase at the airway as exhalation continues into the circuit between the patient and the point of your interruption. This is not an accurate measurement since the interruption necessarily cuts exhalation shorter than it would normally be and because the circuit volume dampens the pressure measurement but this technique can be useful if you are unable to use the more reliable methods outlined above.

In the presence of constant flow,

  • Poor compliance units will have a shortened or normal time constant, and will fill rapidly but incompletely
  • High resistance units will have a long time constant, and will fill slowly 
  • When flow ceases, gas may flow from lung units with poor compliance into lung units with high resistance
  • Exchange of gas between lung units with different time constants is called pendelluft

This has implications for dynamic compliance:

  • With decreased inspiratory time, the fraction of the tidal volume delivered to lung units with long time constants will decrease (i.e. all the tidal volume will go to “faster” lung units)
  • This will have the effect of decreasing dynamic compliance
  • In addition to airway resistance, this factor contibutes to the frequency dependence of dynamic compliance (i.e. dynamic compliance becomes lower with increasing respiratory rates)

For normal lungs, the value for an expiratory time constant is usually given as approximately 100-200 millseconds, i.e over 0.6 seconds 95% of the total lung volume should be emptied. Obviously in states of extreme ICU-level illness, thing may be a little different; especially where airway resistance is increased. For example, Karagiannidis et al (2018) demonstrated time constants around 2500 milliseconds in patients intubated for severe COPD. Interestingly, in ARDS patients, Guttman et al (1995) found expiratory time constants in the range of 600-700 milliseconds, but these were mainly due to the mechanical properties of the endotracheal tube (and the lung itself was not to blame), which supports the concept of a normal but small “baby lung” in ARDS.

Basically, the implication of all these diagrams are that lung units with different time constants will fill at different rates and potentially also up to different final volumes. Then, when the inspiratory flow stops, the lung units with longer time constants (usually described as “slow alveoli”) will continue to fill with “borrowed” gas which redistributes from faster alveoli. This exchange of gas is usually given the term pendelluft, which seems to be the go-to German word to describe any gas movement between different lung units. 

Practically, this can be demonstrated by performing an inspiratory hold manoeuvre on a mechanical ventilator. When one’s mechanical breath has been delivered and the flow stops, the airway pressure first falls abruptly because resistance no longer contributes to it. That part is irrelevant. Then, as one holds the pause for longer, one may be able to see a gradual downward drift of the plateau pressure, as gas is exchanged between lung units with different time constants. This pendellufting of the tidal volume is one of the reasons the recommended duration of an inspiratory hold is about 2 seconds (the other reason for this phenomenon is the relaxation of the lung and chest wall tissues, which contributes to the total airway resistanceand is discussed elsewhere).But how much pendelluftis there in a normal respiratory system? Probably very little. Otis et al (1956) measured time constants from each of the main bronchi belonging to a Dr. Bruce Armstrong, according to the footnote. As one can see from their data (below), “flows in the two bronchi were roughly equal and exactly in phase with each other”. Only when some added resistance was introduced was there a change in the flow timing, seen in the diagram on the right.

Something very similar was the result of some experiments by Bates et al (1988), although these investigators used mongrel dogs instead of healthy colleagues. Alveolar pressure was measured, rather than bronchial pressure, making this somewhat more convincing. There was minimal difference in expiratory flow rates between different lung units in these animals, prompting the authors to remark that “the lungs of these animals …behaved as if they contained a single large and uniform alveolus, with no regional differences in time constants of emptying”.

In summary, in the presence of constant flow,

  • Poor compliance units will have a shortened or normal time constant, and will fill rapidly but incompletely
  • High resistance units will have a long time constant, and will fill slowly 
  • When flow ceases, gas may flow from lung units with poor compliance into lung units with high resistance

Posted in Medical | Leave a Comment »

Bias Flow on Various Ventilators (GE CARESCAPE R860 Ventilator, Maquet Servo I , Puritan Bennett™ 840 Ventilator)

Posted by Dr KAMAL DEEP on July 30, 2023

Q: Bias flow can be set at range settings in one of the given ventilators:

a) Maquet Servo-I

b) GE carescape R860

c) Puritan Bennett™ 840 Ventilator

d) None of the above

Ans is B (GE CARESCAPE R860 Ventilator)

Bias flow on a ventilator refers to the continuous flow of gas that is provided to the patient, even during the expiratory phase of the breathing cycle. During expiration, the ventilator continuously delivers a gas flow (bias flow), which is measured in the expiratory channel. In the Maquet Servo i ventilator, the bias flow is set at factory default values (2 L/min in adults and 0.5 l/min in infants and there is no range settings while in GE CARESCAPE R860 the bias flow can be set as Bias Flow from 2 to 10 l/min and on NIV from 8 to 20 l/min in adult settings .

Patient Unit gas flow diagram of Maquet Servo-I System

Gas flow through the Patient unit
Refer to the Patient Unit gas flow diagram for the location of the following numbered components:

  1. Gas inlet for O2
  2. Gas inlet for air
  3. The gas flow is regulated by the gas modules for Air and O2.
  4. The gases are mixed in the inspiratory mixing section.
  5. The Oxygen concentration can be measured with an O2 cell or O2 sensor.
    An O2 cell is shown here.
    The O2 cell is protected by a bacteria filter.
  6. The pressure of the mixed gas delivered to the patient is measured by the Inspiratory pressure transducer.
    The transducer is protected by a bacterial filter.
  7. The inspiratory channel delivers the mixed gas to the patient systems inspiratory tubing. The inspiratory channel also contains a safety valve.
  8. The patient breathing systems expiratory tubing is connected to the expiratory inlet. The inlet also contains a moisture trap.
  9. The gas flow through the expiratory channel is measured by ultrasonic transducers.
  10. The expiratory pressure is measured by the expiratory pressure transducer (located inside the ventilator). The transducer is protected by a bacterial filter inside the expiratory cassette.
  11. The pressure (PEEP) in the patient system is regulated by the expiratory valve.
  12. Gas from the patient system leaves the ventilator via the expiratory outlet. The outlet contains a non-return valve.

In servo i ventilator , At a trigger sensitivity level above zero (0),The ventilator senses deviations in the bias flow delivered during expiration. These deviations are caused by the inspiratory efforts of the patient. The further to the right on the scale, the more sensitive is the trigger function.
At a trigger sensitivity level below zero (0), the ventilator senses deviations in the pressure below PEEP created by the patient. The pressure below PEEP required to initiate a breath is shown when the setting is made.The further to the left on the scale, the more effort is required to trigger.

Trigger sensitivity
a. Below zero: Trigger sensitivity is
pressure dependant. The pressure below PEEP which the patient must create to initiate an inspiration (cmH2O) is indicated.
b. Above zero: Trigger sensitivity is flow dependent. As the dial is advanced to the right (step wise from the green into the red area) the trigger sensitivity increases i.e the inhaled fraction of the bias flow leading to triggering is reduced.

A green bar indicates a normal setting for flow triggering. The risk of self-triggering increases when the bar is red. A white bar indicates that pressure triggering is required.( Maquet Servo-I)
Getinge Servo -I Maquet System

In GE CARESCAPE R680 , The continuous flow that is circulated through the patient circuit during the expiratory phase of the breath cycle. The bias flow may be increased above this setting by the ventilator for some FiO2 settings.

The Bias Flow rate, set by the clinician will be used to maintain PEEP and for the inspiratory phase of the time cycled mechanical breaths. Insufficient setting of the Bias Flow rate may cause an inability to reach or maintain the set PEEP and or inspiratory pressure during the mechanical breaths.

Bias Flow on GE Carescape
A. Maximum Flow trigger Settings (Maximum Sensitive). Risk of autotrigger
B. Minimum Sensitivity (Pressure trigger)
C. Flow Trigger (decreasing sensitivity) as compare to Fig. A
D. Pressure Trigger ( increasing sensitivity) as compare to Fig. B

Interestingly, the flow trigger setting should probably be in litres per minute (that, after all, is how we measure flow) but this is not viewed as mandatory by all ventilator manufacturers. For instance, the Puritan Bennett 840 allows the user to set a flow trigger directly, in L/min. In the case below the trigger is set to 3L/min.Thus, in the Puritan Bennett models, setting a lower value of flow trigger (eg. 2L/min or 1L/min) represents an increase in sensitivity, i.e. a lower flow required to trigger a mechanical breath. In contrast, in the Maquet SERVO-i model interface, a decreasing trigger value corresponds to a decrease in sensitivity. Their trigger variable is controlled by the twiddly dial on the ventilator and can be tuned to a range of settings from -20 to +10. This range represents an increasing sensitivity of the trigger, from least sensitive at -20 to most sensitive at 10.

How Bias Flow is used for Flow Triggering : When a patient takes a breath, some of the flow is directed into their lungs. The expiratory flow rate in the ventilator circuit is decreased by this, such that Vin – Vout = x, where x is some “missing” flow measured in L/min. Flow triggering occurs when this missing flow reaches some prescribed threshold value, which causes the ventilator to open the inspiratory valve and deliver a breath. The exact value is susceptible to manipulation via the settings, and the default setting differs between manufacturers, but generally it’s in the ballpark of 1-2 L/min.

For comparison, the normal
mean inspiratory flow rate at rest is probably about 15L/min, with a peak of around 30- 35L/min (Tobin et al, 1983) which makes this a relatively effortless goal to achieve.

To make things more confusing, the range between -20 and 0 actually represents a pressure trigger; the values in this range correspond to a negative pressure in cm H2O, such that a setting of -20 represents a pressure trigger of -20 cm H2O. The range between 0 and 10 represents a flow trigger, and corresponds to a percentage of the bias flow which needs to be “deflected” by the patient in order to trigger the mechanical breath.

A setting of 0 is the least sensitive flow trigger, and represents a 100% deflection (i.e. the patient must generate a flow equal to 100% of the bias flow though the circuit, or 2L/min). A trigger of 10 is the most sensitive, and represents a flow deflection close to 1% of the bias flow. The default setting of a recently reset/restarted SERVO-i ventilator is a flow trigger of 5, which corresponds to a bias flow change of 50%, or 1L/min.

Servo-I; The trigger sensitivity bar is colored based on the setting:
the bar is green for a normal setting for flow triggering
the bar is red when there is a risk of self-triggering
the bar is white when pressure triggering is selected.

Pressure triggering
Pressure triggering describes a method whereby a decrease in circuit pressure is detected by the ventilator pressure sensors and interpreted as patient effort. The patient inhales against a close inspiratory valve, producing a pressure drop by this effort, and in response, the ventilator delivers a mechanical breath by opening the inspiratory valve. Conventionally, where a pressure trigger is used for a prolonged period, a typical setting would be 1 cm H2O.

Posted in Medical | 2 Comments »

Do No Harm: Exposing the Hippocratic Hoax

Posted by Dr KAMAL DEEP on October 11, 2019

A film by Robyn Symon

Host a Screening of DO NO HARM

at your School, Hospital or Event

Click here :

http://www.donoharmfilm.com/screenings

Posted in Medical | Leave a Comment »